

mw Methods Useful in Genetics and Oncology
·A . .
c
I
I I
~5
;,
-l JJ B
I I I I I I I I I I
1 1.5 2 l5 3
Wj!J.rm5m
I
I I I I I I I
15 4 (5 5
1
. , . I I I ' 1 ' 1 ' I
•
I
f l ' I I
I
I
I I
I " f"" I I
,(5 I I I • I I I ' 1 I , I I 1 I I , 1 I I I I I I I I t I I
~
~
m n u ~ ~ ~ ~ ~ ~ ~ ~ ~ ~
1--..1tI
'"
II
]I
lZ
5 ] 1
«l
42
..
"
..
!U
51
I'
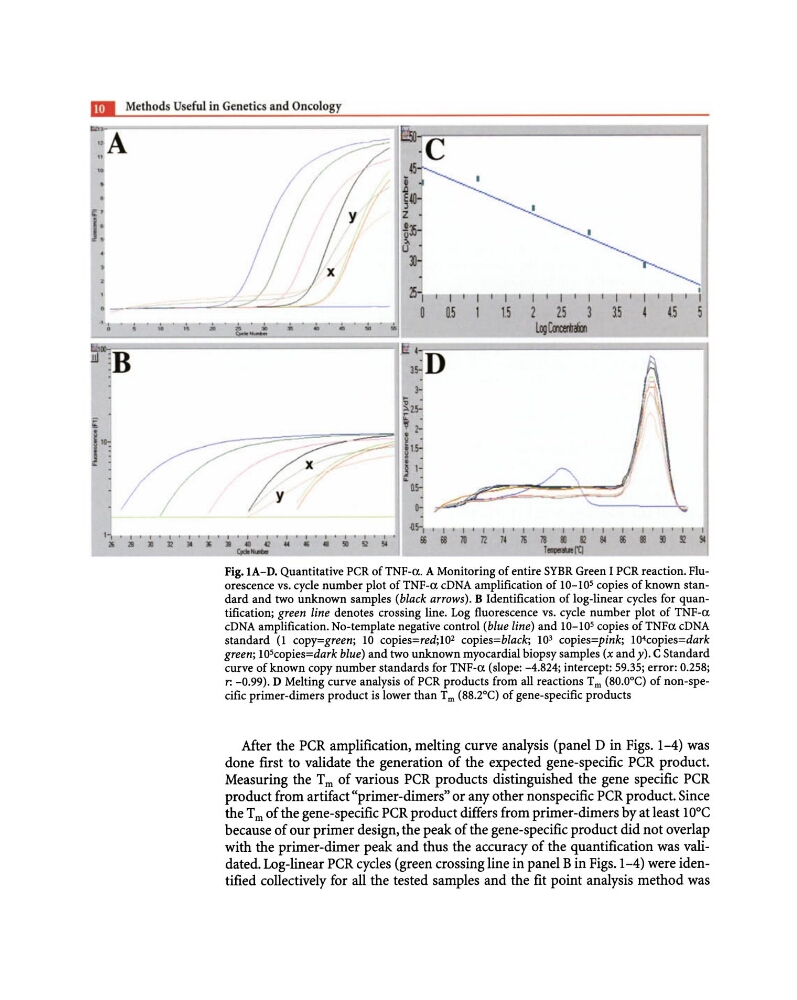
CidoFig. lA-D. Quantitative PCR of TNF-a. A Monitoring of entire SYBR Green I PCR reaction. Fluorescence vs. cycle number plot of TNF-a eDNA amplification of 10-105 copies of known standard and two unknown samples (black arrows). B Identification of log-linear cycles for quantification; green line denotes crossing line. Log fluorescence vs. cycle number plot of TNF-a
eDNA amplification. No-template negative control (blue line) and 10-105 copies of TNFa eDNA
standard (1 copy=green; 10 copies=red;102 copies=black; 10 3 copies=pink; 104copies=dark
green; 10 5 copies=dark blue) and two unknown myocardial biopsy samples (x and y). C Standard
curve of known copy number standards for TNF-a (slope: -4.824; intercept: 59.35; error: 0.258;
r: -0.99). D Melting curve analysis of PCR products from all reactions Tm (80.0°C) of non-specific primer-dimers product is lower than Tm (88.2°C) of gene-specific products
After the PCR amplification, melting curve analysis (panel D in Figs. 1-4) was
done first to validate the generation of the expected gene-specific PCR product.
Measuring the T m of various PCR products distinguished the gene specific PCR
product from artifact "primer-dimers" or any other nonspecific PCR product. Since
the T m of the gene-specific PCR product differs from primer -dimers by at least 10°C
because of our primer design, the peak of the gene-specific product did not overlap
with the primer-dimer peak and thus the accuracy of the quantification was validated. Log-linear PCR cycles (green crossing line in panel B in Figs. 1-4) were identified collectively for all the tested samples and the fit point analysis method was
·A . .
c
I
I I
~5
;,
-l JJ B
I I I I I I I I I I
1 1.5 2 l5 3
Wj!J.rm5m
I
I I I I I I I
15 4 (5 5
1
. , . I I I ' 1 ' 1 ' I
•
I
f l ' I I
I
I
I I
I " f"" I I
,(5 I I I • I I I ' 1 I , I I 1 I I , 1 I I I I I I I I t I I
~
~
m n u ~ ~ ~ ~ ~ ~ ~ ~ ~ ~
1--..1tI
'"
II
]I
lZ
5 ] 1
«l
42
..
"
..
!U
51
I'
CidoFig. lA-D. Quantitative PCR of TNF-a. A Monitoring of entire SYBR Green I PCR reaction. Fluorescence vs. cycle number plot of TNF-a eDNA amplification of 10-105 copies of known standard and two unknown samples (black arrows). B Identification of log-linear cycles for quantification; green line denotes crossing line. Log fluorescence vs. cycle number plot of TNF-a
eDNA amplification. No-template negative control (blue line) and 10-105 copies of TNFa eDNA
standard (1 copy=green; 10 copies=red;102 copies=black; 10 3 copies=pink; 104copies=dark
green; 10 5 copies=dark blue) and two unknown myocardial biopsy samples (x and y). C Standard
curve of known copy number standards for TNF-a (slope: -4.824; intercept: 59.35; error: 0.258;
r: -0.99). D Melting curve analysis of PCR products from all reactions Tm (80.0°C) of non-specific primer-dimers product is lower than Tm (88.2°C) of gene-specific products
After the PCR amplification, melting curve analysis (panel D in Figs. 1-4) was
done first to validate the generation of the expected gene-specific PCR product.
Measuring the T m of various PCR products distinguished the gene specific PCR
product from artifact "primer-dimers" or any other nonspecific PCR product. Since
the T m of the gene-specific PCR product differs from primer -dimers by at least 10°C
because of our primer design, the peak of the gene-specific product did not overlap
with the primer-dimer peak and thus the accuracy of the quantification was validated. Log-linear PCR cycles (green crossing line in panel B in Figs. 1-4) were identified collectively for all the tested samples and the fit point analysis method was