

Quantification of Cytokine mRNAs in Human Myocardial Biopsy Samples . ,
sequence by automated sequencing, the plasmids were digested with the appropriate restriction enzymes to generate the copy-number template standards for
cytokine mRNAs. The expected fragment sizes were confirmed by agarose gelelectrophoresis and the DNA fragments were eluted according to the manufacturer's protocol (Qiagen). The concentrations of the cDNA fragments were determined spectrophotometrically. Copy numbers of cDNAs were empirically determined using the following equation: copy number=(grams/MW) x Avogadro
constant (Avogadro constant=6.0221367xl0 23 ). The quantified cDNA fragments
were later serially diluted in log increments and were used as known copy-number template standards in quantitative PCR.
Results
Before conducting the quantitative PCR, the synthesized PCR primers were first
tested in a conventional gradient thermo cycler (Biometra) to determine the optimal cycling conditions for generating appropriate gene-specific PCR products.
This is especially important since PCR amplification can occur at a wide variety
of conditions. The optimal annealing temperature for primers was chosen based
on the maximal yield of gene-specific PCR product with very low or no formation
of primer-dimers or nonspecific products. Later, these optimal PCR conditions
were imported into the LightCycler for conducting quantitative PCR. The first 5-6
capillaries contained an empirically determined appropriate known copy number
standard cDNA serially diluted (I -10- 6 ) with water from a stock solution. A negative control with no template cDNA was also included. The range for the copy
number cDNA standards for the respective cytokines was chosen based on its
expected amount in the myocardium. Each unknown cDNA sample was measured twice with two dilutions. The PCR reaction mixtures were assembled first
and later transferred into precooled capillaries, placed into special adapters, and
quickly centrifuged to bring the reaction mixture to the bottom of the capillaries.
After placing the capillaries into the rotor of the LightCycler instrument, quantitative PCR cycling was initiated and the real-time amplification was monitored
(panel A in Figs. 1-4) using the LightCycler software.
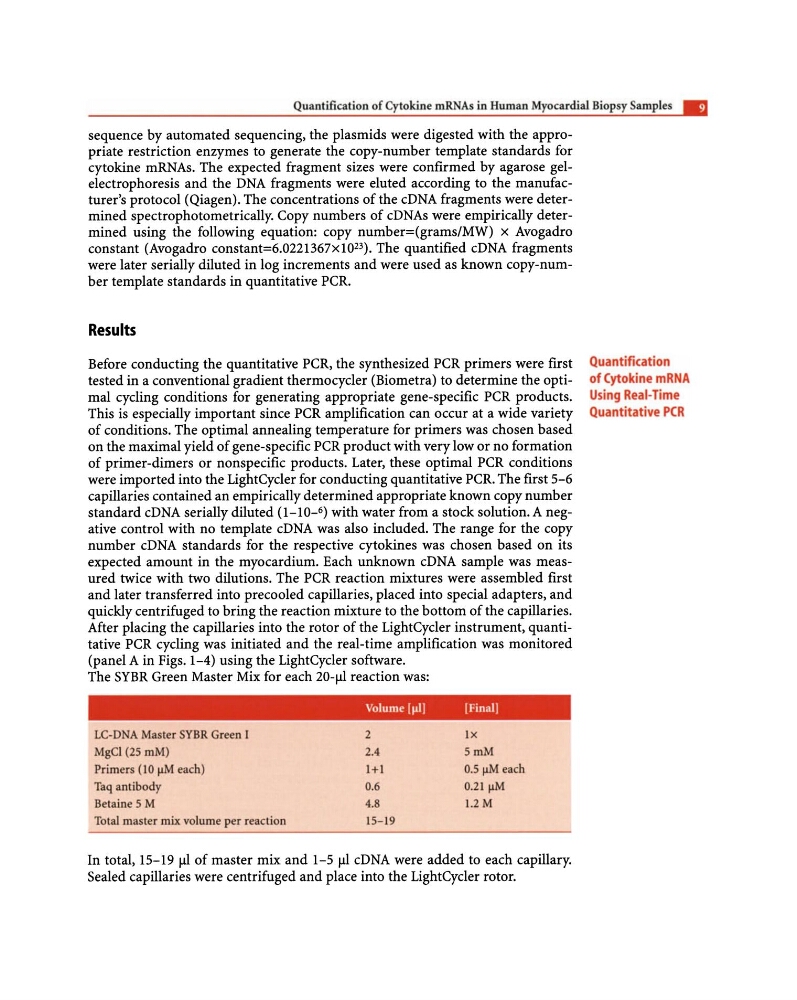
The SYBR Green Master Mix for each 20-~ reaction was:
Volume IJlI I
[Final )
LC-DNA Master SYBR Green [
2
Ix
MgCI (25 mM)
2.4
5mM
Primers (10 f!M each)
1+1
0.5 J1M each
Taq antibody
0.6
0.21 JIM
Belaine 5 M
4.8
I.2M
Total master mix volume per reaction
15-19
In total, 15-19 ~ of master mix and 1-5 III cDNA were added to each capillary.
Sealed capillaries were centrifuged and place into the LightCycler rotor.
Quantification
of Cytokine mRNA
Using Real-Time
Quantitative PCR
sequence by automated sequencing, the plasmids were digested with the appropriate restriction enzymes to generate the copy-number template standards for
cytokine mRNAs. The expected fragment sizes were confirmed by agarose gelelectrophoresis and the DNA fragments were eluted according to the manufacturer's protocol (Qiagen). The concentrations of the cDNA fragments were determined spectrophotometrically. Copy numbers of cDNAs were empirically determined using the following equation: copy number=(grams/MW) x Avogadro
constant (Avogadro constant=6.0221367xl0 23 ). The quantified cDNA fragments
were later serially diluted in log increments and were used as known copy-number template standards in quantitative PCR.
Results
Before conducting the quantitative PCR, the synthesized PCR primers were first
tested in a conventional gradient thermo cycler (Biometra) to determine the optimal cycling conditions for generating appropriate gene-specific PCR products.
This is especially important since PCR amplification can occur at a wide variety
of conditions. The optimal annealing temperature for primers was chosen based
on the maximal yield of gene-specific PCR product with very low or no formation
of primer-dimers or nonspecific products. Later, these optimal PCR conditions
were imported into the LightCycler for conducting quantitative PCR. The first 5-6
capillaries contained an empirically determined appropriate known copy number
standard cDNA serially diluted (I -10- 6 ) with water from a stock solution. A negative control with no template cDNA was also included. The range for the copy
number cDNA standards for the respective cytokines was chosen based on its
expected amount in the myocardium. Each unknown cDNA sample was measured twice with two dilutions. The PCR reaction mixtures were assembled first
and later transferred into precooled capillaries, placed into special adapters, and
quickly centrifuged to bring the reaction mixture to the bottom of the capillaries.
After placing the capillaries into the rotor of the LightCycler instrument, quantitative PCR cycling was initiated and the real-time amplification was monitored
(panel A in Figs. 1-4) using the LightCycler software.
The SYBR Green Master Mix for each 20-~ reaction was:
Volume IJlI I
[Final )
LC-DNA Master SYBR Green [
2
Ix
MgCI (25 mM)
2.4
5mM
Primers (10 f!M each)
1+1
0.5 J1M each
Taq antibody
0.6
0.21 JIM
Belaine 5 M
4.8
I.2M
Total master mix volume per reaction
15-19
In total, 15-19 ~ of master mix and 1-5 III cDNA were added to each capillary.
Sealed capillaries were centrifuged and place into the LightCycler rotor.
Quantification
of Cytokine mRNA
Using Real-Time
Quantitative PCR