

Quantification of Cylokine mRNAs in Human Myocardial Biopsy Samples . . .
!
..
X
,. ,. ;. a '"
-j
yx
.. • :. ;.
· 35
3D
I I I I I I I I I I I I
1 1.5 22.5 3 15
lD,j CmmIAm
I
I I I
4.5 5
,
I I I ' f I I I I
• I ' I I I •
I •
I I I I i I t I I
I
.. .
, . . . . I
•
, ..
I
•
I
•
, •
,
•
t
•
I
I
'
I
. . . '
I
'
•
~
V ~
~
» ~ Q u • • •
~
c,a.~
~
ro n n ~ ~ ~ ~ ~ ~ • ~ ~ ~
l_rtI
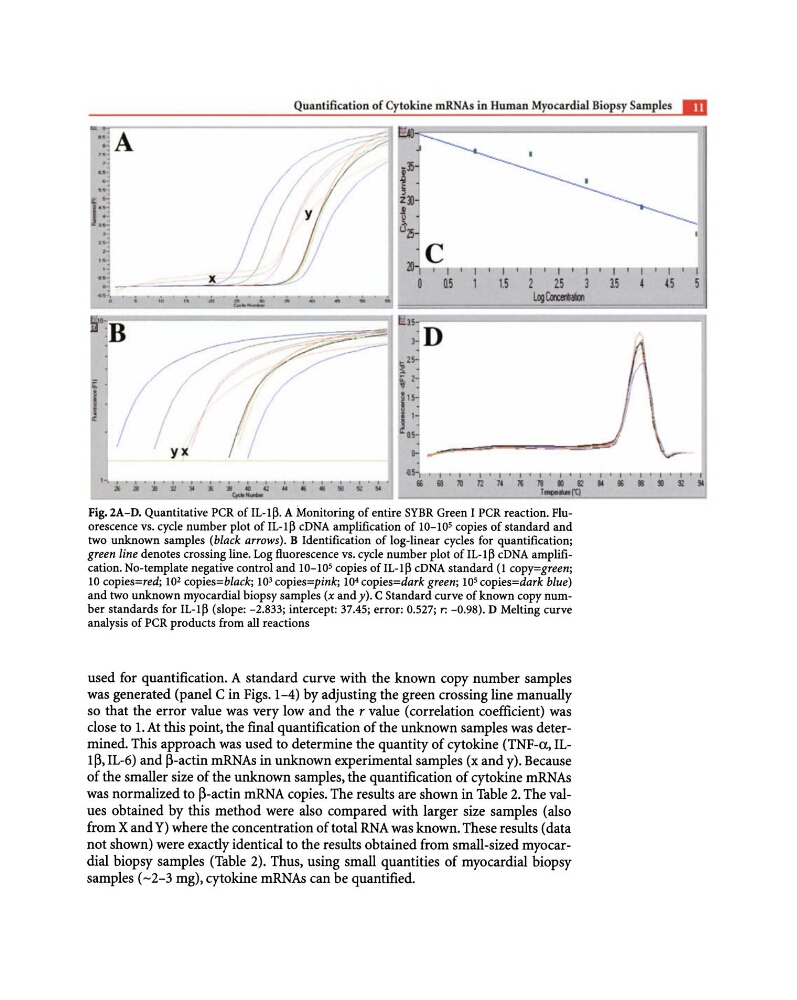
Fig.2A-D. Quantitative peR of IL-I13. A Monitoring of entire SYBR Green I peR reaction. Fluorescence vs. cycle number plot of IL-I13 cDNA amplification of 10-10 5 copies of standard and
two unknown samples (black arrows). B Identification of log-linear cycles for quantification;
green line denotes crossing line. Log fluorescence vs. cycle number plot of IL-I13 cDNA amplification. No-template negative control and 10-105 copies of IL-I13 cDNA standard (1 copy=green;
10 copies=red; 10 2 copies=black; 10 3 copies=pink; 10 4 copies=dark green; 105 copies=dark blue)
and two unknown myocardial biopsy samples (x and y). C Standard curve of known copy number standards for IL-I13 (slope: -2.833; intercept: 37.45; error: 0.527; r: -0.98). D Melting curve
analysis of peR products from all reactions
used for quantification. A standard curve with the known copy number samples
was generated (panel C in Figs. 1-4) by adjusting the green crossing line manually
so that the error value was very low and the r value (correlation coefficient) was
close to 1. At this point, the final quantification of the unknown samples was determined. This approach was used to determine the quantity of cytokine (TNF-a, IL1/3,IL-6) and /3-actin mRNAs in unknown experimental samples (x and y). Because
of the smaller size of the unknown samples, the quantification of cytokine mRNAs
was normalized to /3-actin mRNA copies. The results are shown in Table 2. The values obtained by this method were also compared with larger size samples (also
from X and Y) where the concentration of total RNA was known. These results (data
not shown) were exactly identical to the results obtained from small-sized myocardial biopsy samples (Table 2). Thus, using small quantities of myocardial biopsy
samples (-2-3 mg), cytokine mRNAs can be quantified.
!
..
X
,. ,. ;. a '"
-j
yx
.. • :. ;.
· 35
3D
I I I I I I I I I I I I
1 1.5 22.5 3 15
lD,j CmmIAm
I
I I I
4.5 5
,
I I I ' f I I I I
• I ' I I I •
I •
I I I I i I t I I
I
.. .
, . . . . I
•
, ..
I
•
I
•
, •
,
•
t
•
I
I
'
I
. . . '
I
'
•
~
V ~
~
» ~ Q u • • •
~
c,a.~
~
ro n n ~ ~ ~ ~ ~ ~ • ~ ~ ~
l_rtI
Fig.2A-D. Quantitative peR of IL-I13. A Monitoring of entire SYBR Green I peR reaction. Fluorescence vs. cycle number plot of IL-I13 cDNA amplification of 10-10 5 copies of standard and
two unknown samples (black arrows). B Identification of log-linear cycles for quantification;
green line denotes crossing line. Log fluorescence vs. cycle number plot of IL-I13 cDNA amplification. No-template negative control and 10-105 copies of IL-I13 cDNA standard (1 copy=green;
10 copies=red; 10 2 copies=black; 10 3 copies=pink; 10 4 copies=dark green; 105 copies=dark blue)
and two unknown myocardial biopsy samples (x and y). C Standard curve of known copy number standards for IL-I13 (slope: -2.833; intercept: 37.45; error: 0.527; r: -0.98). D Melting curve
analysis of peR products from all reactions
used for quantification. A standard curve with the known copy number samples
was generated (panel C in Figs. 1-4) by adjusting the green crossing line manually
so that the error value was very low and the r value (correlation coefficient) was
close to 1. At this point, the final quantification of the unknown samples was determined. This approach was used to determine the quantity of cytokine (TNF-a, IL1/3,IL-6) and /3-actin mRNAs in unknown experimental samples (x and y). Because
of the smaller size of the unknown samples, the quantification of cytokine mRNAs
was normalized to /3-actin mRNA copies. The results are shown in Table 2. The values obtained by this method were also compared with larger size samples (also
from X and Y) where the concentration of total RNA was known. These results (data
not shown) were exactly identical to the results obtained from small-sized myocardial biopsy samples (Table 2). Thus, using small quantities of myocardial biopsy
samples (-2-3 mg), cytokine mRNAs can be quantified.