

Ili!jJ Applications in Oncology
III
c:
:I
~
'E «I
'a
c
«I
t;;
500000
450000
400000
350000
300000
250000
200000
150000
100000
50000
o
L
/ .
V
• L
y'
V
~
f
V"
o
200000 400000 600000 800000
Calibrator
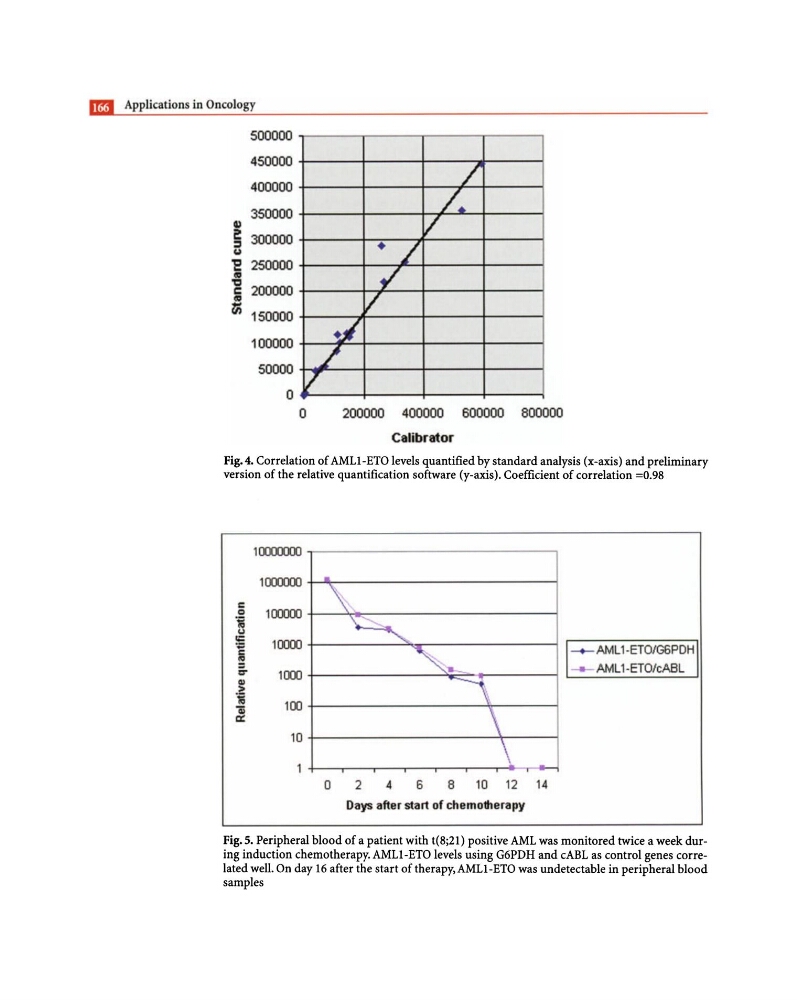
Fig. 4. Correlation of AMLl-ETO levels quantified by standard analysis (x-axis) and preliminary
version of the relative quantification software (y-axis). Coefficient of correlation =0.98
10000C0J
100000l
c
0
100000
"i u
=
10000
C
~
;.
1000
QI
.~
16
100
Qj
a:
10
..
\
~
~-.
\ \ \
o 2 4 6 8 10 12 14
Days after start of chemo1herapy
...- AML1-ETO/G6PDH
AML1-ETO/cA8L
Fig. 5. Peripheral blood of a patient with t(8;21) positive AML was monitored twice a week during induction chemotherapy. AMLl-ETO levels using G6PDH and cABL as control genes correlated well. On day 16 after the start of therapy, AMLl-ETO was undetectable in peripheral blood
samples
III
c:
:I
~
'E «I
'a
c
«I
t;;
500000
450000
400000
350000
300000
250000
200000
150000
100000
50000
o
L
/ .
V
• L
y'
V
~
f
V"
o
200000 400000 600000 800000
Calibrator
Fig. 4. Correlation of AMLl-ETO levels quantified by standard analysis (x-axis) and preliminary
version of the relative quantification software (y-axis). Coefficient of correlation =0.98
10000C0J
100000l
c
0
100000
"i u
=
10000
C
~
;.
1000
QI
.~
16
100
Qj
a:
10
..
\
~
~-.
\ \ \
o 2 4 6 8 10 12 14
Days after start of chemo1herapy
...- AML1-ETO/G6PDH
AML1-ETO/cA8L
Fig. 5. Peripheral blood of a patient with t(8;21) positive AML was monitored twice a week during induction chemotherapy. AMLl-ETO levels using G6PDH and cABL as control genes correlated well. On day 16 after the start of therapy, AMLl-ETO was undetectable in peripheral blood
samples