

7.2 Wave Spectrum Evolution in Water with Ice Cakes
323
change by three orders of magnitude within the range from 1 to 10 3 cm 2 s- 1
(Kheysin, 1967).
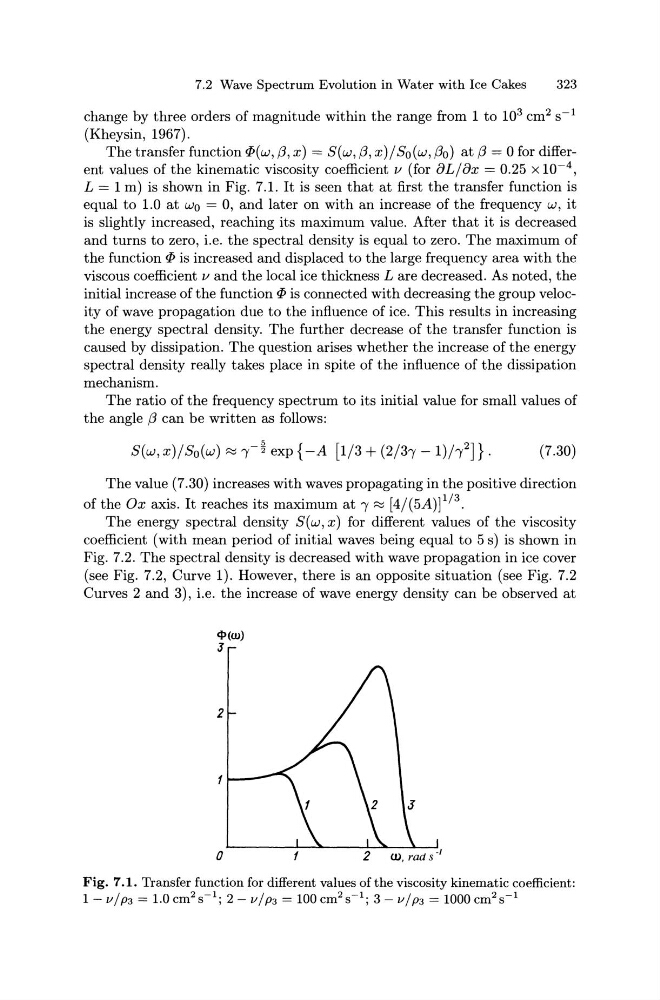
The transfer function tl>(w,f3,x) = S(w,/3, x)/S0 (w,f3o) at f3 = 0 for different values of the kinematic viscosity coefficient v (for 8Lj8x = 0.25 x w-4,
L = 1m) is shown in Fig. 7.1. It is seen that at first the transfer function is
equal to 1.0 at w0 = 0, and later on with an increase of the frequency w, it
is slightly increased, reaching its maximum value. After that it is decreased
and turns to zero, i.e. the spectral density is equal to zero. The maximum of
the function ti> is increased and displaced to the large frequency area with the
viscous coefficient v and the local ice thickness L are decreased. As noted, the
initial increase of the function ti> is connected with decreasing the group velocity of wave propagation due to the influence of ice. This results in increasing
the energy spectral density. The further decrease of the transfer function is
caused by dissipation. The question arises whether the increase of the energy
spectral density really takes place in spite of the influence of the dissipation
mechanism.
The ratio of the frequency spectrum to its initial value for small values of
the angle f3 can be written as follows:
(7.30)
The value (7.30) increases with waves propagating in the positive direction
of the Ox axis. It reaches its maximum at 1 ~ [4/(5A)] 1 / 3 .
The energy spectral density S(w, x) for different values of the viscosity
coefficient (with mean period of initial waves being equal to 5 s) is shown in
Fig. 7.2. The spectral density is decreased with wave propagation in ice cover
(see Fig. 7.2, Curve 1). However, there is an opposite situation (see Fig. 7.2
Curves 2 and 3), i.e. the increase of wave energy density can be observed at
0
W, rad s· 1
Fig. 7.1. Transfer function for different values of the viscosity kinematic coefficient:
1- vjp3 = 1.0 cm 2 s- 1 ; 2- vjp3 = 100 cm 2 s-\ 3- vjp3 = 1000 cm 2 s- 1
323
change by three orders of magnitude within the range from 1 to 10 3 cm 2 s- 1
(Kheysin, 1967).
The transfer function tl>(w,f3,x) = S(w,/3, x)/S0 (w,f3o) at f3 = 0 for different values of the kinematic viscosity coefficient v (for 8Lj8x = 0.25 x w-4,
L = 1m) is shown in Fig. 7.1. It is seen that at first the transfer function is
equal to 1.0 at w0 = 0, and later on with an increase of the frequency w, it
is slightly increased, reaching its maximum value. After that it is decreased
and turns to zero, i.e. the spectral density is equal to zero. The maximum of
the function ti> is increased and displaced to the large frequency area with the
viscous coefficient v and the local ice thickness L are decreased. As noted, the
initial increase of the function ti> is connected with decreasing the group velocity of wave propagation due to the influence of ice. This results in increasing
the energy spectral density. The further decrease of the transfer function is
caused by dissipation. The question arises whether the increase of the energy
spectral density really takes place in spite of the influence of the dissipation
mechanism.
The ratio of the frequency spectrum to its initial value for small values of
the angle f3 can be written as follows:
(7.30)
The value (7.30) increases with waves propagating in the positive direction
of the Ox axis. It reaches its maximum at 1 ~ [4/(5A)] 1 / 3 .
The energy spectral density S(w, x) for different values of the viscosity
coefficient (with mean period of initial waves being equal to 5 s) is shown in
Fig. 7.2. The spectral density is decreased with wave propagation in ice cover
(see Fig. 7.2, Curve 1). However, there is an opposite situation (see Fig. 7.2
Curves 2 and 3), i.e. the increase of wave energy density can be observed at
0
W, rad s· 1
Fig. 7.1. Transfer function for different values of the viscosity kinematic coefficient:
1- vjp3 = 1.0 cm 2 s- 1 ; 2- vjp3 = 100 cm 2 s-\ 3- vjp3 = 1000 cm 2 s- 1