

314
6 Wave Transformation in Shallow Water
SWAN
3.0
2.5
2.0
1.5
1.0
0.5
0.0
0.5
1.0
1.5
2.0
2.5
3.0
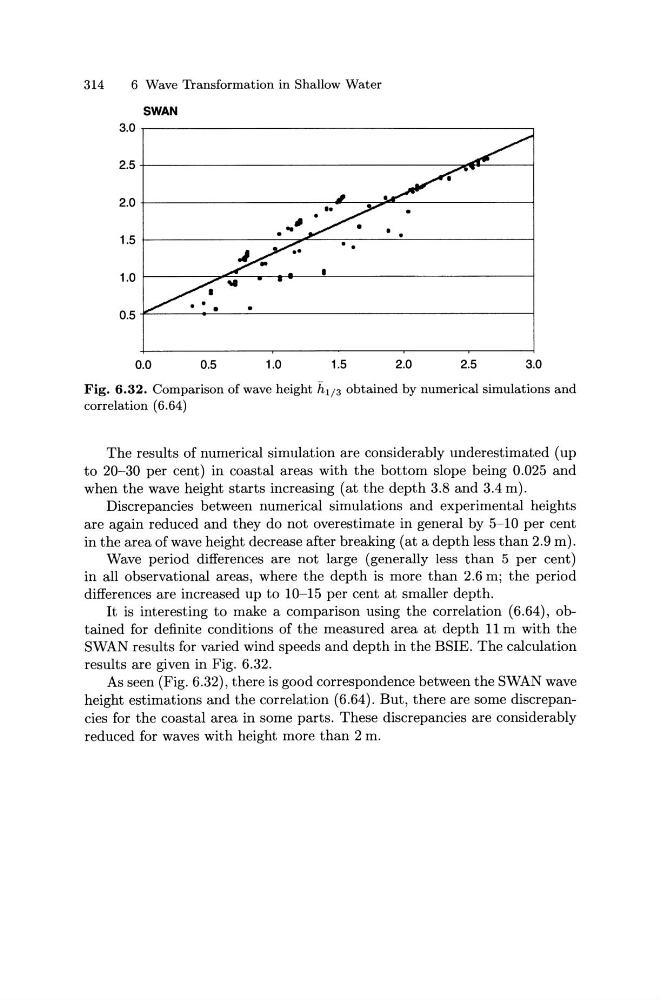
Fig. 6.32. Comparison of wave height h1; 3 obtained by numerical simulations and
correlation (6.64)
The results of numerical simulation are considerably underestimated (up
to 20-30 per cent) in coastal areas with the bottom slope being 0.025 and
when the wave height starts increasing (at the depth 3.8 and 3.4 m).
Discrepancies between numerical simulations and experimental heights
are again reduced and they do not overestimate in general by 5-10 per cent
in the area of wave height decrease after breaking (at a depth less than 2.9 m).
Wave period differences are not large (generally less than 5 per cent)
in all observational areas, where the depth is more than 2.6 m; the period
differences are increased up to 10-15 per cent at smaller depth.
It is interesting to make a comparison using the correlation (6.64), obtained for definite conditions of the measured area at depth 11 m with the
SWAN results for varied wind speeds and depth in the BSIE. The calculation
results are given in Fig. 6.32.
As seen (Fig. 6.32), there is good correspondence between the SWAN wave
height estimations and the correlation (6.64). But, there are some discrepancies for the coastal area in some parts. These discrepancies are considerably
reduced for waves with height more than 2m.
6 Wave Transformation in Shallow Water
SWAN
3.0
2.5
2.0
1.5
1.0
0.5
0.0
0.5
1.0
1.5
2.0
2.5
3.0
Fig. 6.32. Comparison of wave height h1; 3 obtained by numerical simulations and
correlation (6.64)
The results of numerical simulation are considerably underestimated (up
to 20-30 per cent) in coastal areas with the bottom slope being 0.025 and
when the wave height starts increasing (at the depth 3.8 and 3.4 m).
Discrepancies between numerical simulations and experimental heights
are again reduced and they do not overestimate in general by 5-10 per cent
in the area of wave height decrease after breaking (at a depth less than 2.9 m).
Wave period differences are not large (generally less than 5 per cent)
in all observational areas, where the depth is more than 2.6 m; the period
differences are increased up to 10-15 per cent at smaller depth.
It is interesting to make a comparison using the correlation (6.64), obtained for definite conditions of the measured area at depth 11 m with the
SWAN results for varied wind speeds and depth in the BSIE. The calculation
results are given in Fig. 6.32.
As seen (Fig. 6.32), there is good correspondence between the SWAN wave
height estimations and the correlation (6.64). But, there are some discrepancies for the coastal area in some parts. These discrepancies are considerably
reduced for waves with height more than 2m.