

312
6 Wave Transformation in Shallow Water
trum. It is reduced with deviation from this frequency both to the low and
high frequency ranges.
The dependence on the relative depth is as follows:
- values of the power degree {3, corresponding t o the frequency of the
maximum spectrum, and to those higher and lower than the frequency of the
maximum spectrum, exceed similar values for the deep water case;
- values of the power degree f3 are increased at all frequencies with depth
decrease.
These regularities of the angular distribution can be approximated as
follows:
f3 = f3(w) = Aw- 2 · 5 , A= 45 -18wH, 0.5 < wH < 1.6;
w= {w:
~
w
for W :::; Wmax ;
for w > Wmax.
SWAN
3.0
2.5
2.0
1.5
1.0
0.5
0.0
0.0
SWAN
2.0
1.5
1.0
0.5
0.0
0.0
0.5
A , ...
~
. ~~ . . ,
,... .
1.0
2.0
• t
••
X • ..,.,. f A
1.0
A
A
•
• • A
A
1.5
A
A 18m
• 11 m
• 4.5m
x 4.2m
e 3.8m
hmeas.
3.0
2.0
A3.4 m
• 3.2 m
• 2.9 m
x 2.6 m
x 1.6 m
e 1.3 m
(6.69)
(6.70)
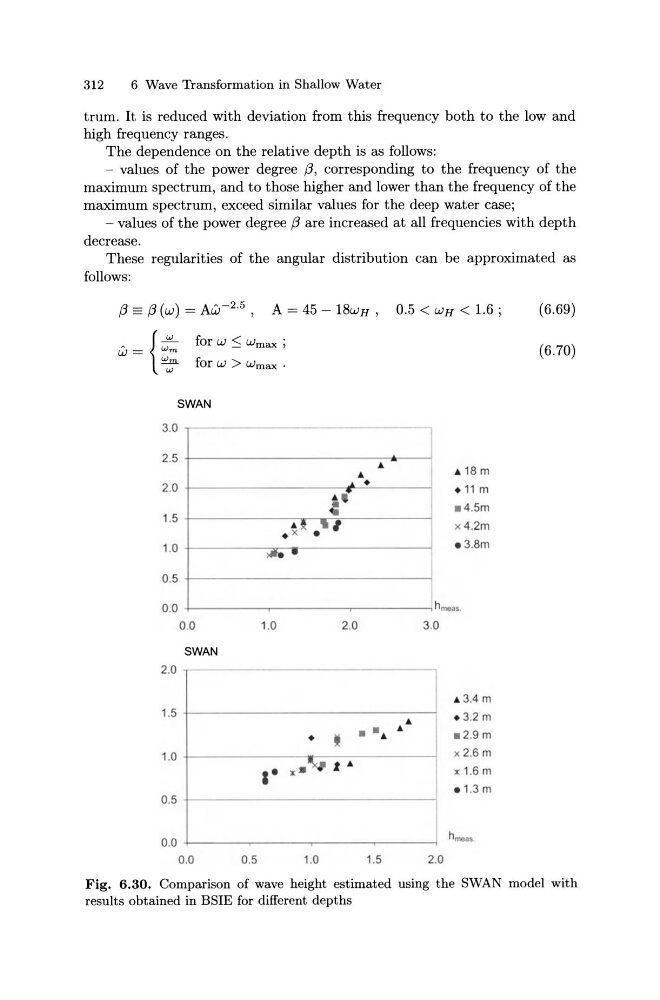
Fig. 6.30. Comparison of wave height estimated using the SWAN model with
results obtained in BSIE for different depths
6 Wave Transformation in Shallow Water
trum. It is reduced with deviation from this frequency both to the low and
high frequency ranges.
The dependence on the relative depth is as follows:
- values of the power degree {3, corresponding t o the frequency of the
maximum spectrum, and to those higher and lower than the frequency of the
maximum spectrum, exceed similar values for the deep water case;
- values of the power degree f3 are increased at all frequencies with depth
decrease.
These regularities of the angular distribution can be approximated as
follows:
f3 = f3(w) = Aw- 2 · 5 , A= 45 -18wH, 0.5 < wH < 1.6;
w= {w:
~
w
for W :::; Wmax ;
for w > Wmax.
SWAN
3.0
2.5
2.0
1.5
1.0
0.5
0.0
0.0
SWAN
2.0
1.5
1.0
0.5
0.0
0.0
0.5
A , ...
~
. ~~ . . ,
,... .
1.0
2.0
• t
••
X • ..,.,. f A
1.0
A
A
•
• • A
A
1.5
A
A 18m
• 11 m
• 4.5m
x 4.2m
e 3.8m
hmeas.
3.0
2.0
A3.4 m
• 3.2 m
• 2.9 m
x 2.6 m
x 1.6 m
e 1.3 m
(6.69)
(6.70)
Fig. 6.30. Comparison of wave height estimated using the SWAN model with
results obtained in BSIE for different depths