

6.6 Black Sea International Experiment
311
H=18m
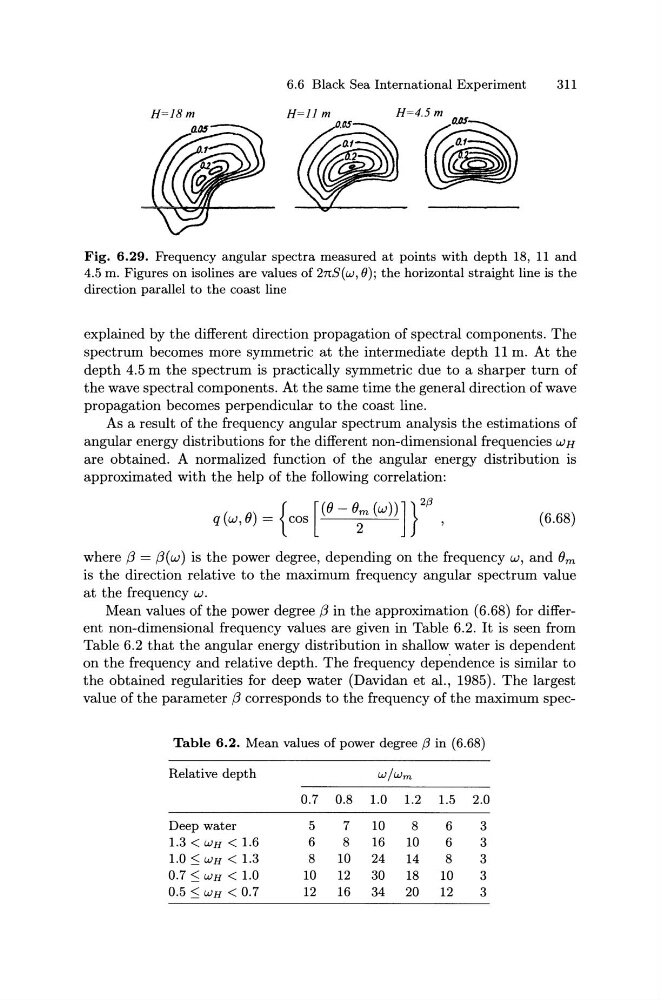
Fig. 6.29. Frequency angular spectra measured at points with depth 18, 11 and
4.5 m. Figures on isolines are values of 2nS(w, 6); the horizontal straight line is the
direction parallel to the coast line
explained by the different direction propagation of spectral components. The
spectrum becomes more symmetric at the intermediate depth 11 m. At the
depth 4.5 m the spectrum is practically symmetric due to a sharper turn of
the wave spectral components. At the same time the general direction of wave
propagation becomes perpendicular to the coast line.
As a result of the frequency angular spectrum analysis the estimations of
angular energy distributions for the different non-dimensional frequencies WH
are obtained. A normalized function of the angular energy distribution is
approximated with the help of the following correlation:
(6.68)
where f3 = f3(w) is the power degree, depending on the frequency w, and Om
is the direction relative to the maximum frequency angular spectrum value
at the frequency w.
Mean values of the power degree f3 in the approximation (6.68) for different non-dimensional frequency values are given in Table 6.2. It is seen from
Table 6.2 that the angular energy distribution in shallow water is dependent
on the frequency and relative depth. The frequency dependence is similar to
the obtained regularities for deep water (Davidan et al., 1985). The largest
value of the parameter f3 corresponds to the frequency of the maximum specTable 6.2. Mean values of power degree (3 in (6.68)
Relative depth
w/wm
0.7 0.8 1.0 1.2 1.5 2.0
Deep water
5
7
10
8
6
3
1.3 < WH < 1.6
6
8
16
10
6
3
1.0 S WH < 1.3
8
10
24
14
8
3
0.7 S WH < 1.0
10
12
30
18
10
3
0.5 S WH < 0.7
12
16
34
20
12
3
311
H=18m
Fig. 6.29. Frequency angular spectra measured at points with depth 18, 11 and
4.5 m. Figures on isolines are values of 2nS(w, 6); the horizontal straight line is the
direction parallel to the coast line
explained by the different direction propagation of spectral components. The
spectrum becomes more symmetric at the intermediate depth 11 m. At the
depth 4.5 m the spectrum is practically symmetric due to a sharper turn of
the wave spectral components. At the same time the general direction of wave
propagation becomes perpendicular to the coast line.
As a result of the frequency angular spectrum analysis the estimations of
angular energy distributions for the different non-dimensional frequencies WH
are obtained. A normalized function of the angular energy distribution is
approximated with the help of the following correlation:
(6.68)
where f3 = f3(w) is the power degree, depending on the frequency w, and Om
is the direction relative to the maximum frequency angular spectrum value
at the frequency w.
Mean values of the power degree f3 in the approximation (6.68) for different non-dimensional frequency values are given in Table 6.2. It is seen from
Table 6.2 that the angular energy distribution in shallow water is dependent
on the frequency and relative depth. The frequency dependence is similar to
the obtained regularities for deep water (Davidan et al., 1985). The largest
value of the parameter f3 corresponds to the frequency of the maximum specTable 6.2. Mean values of power degree (3 in (6.68)
Relative depth
w/wm
0.7 0.8 1.0 1.2 1.5 2.0
Deep water
5
7
10
8
6
3
1.3 < WH < 1.6
6
8
16
10
6
3
1.0 S WH < 1.3
8
10
24
14
8
3
0.7 S WH < 1.0
10
12
30
18
10
3
0.5 S WH < 0.7
12
16
34
20
12
3