

308
6 Wave Transformation in Shallow Water
SrMA (f) m
2 s
60
50
40
30
20
10
0
2
o.2 rs-l
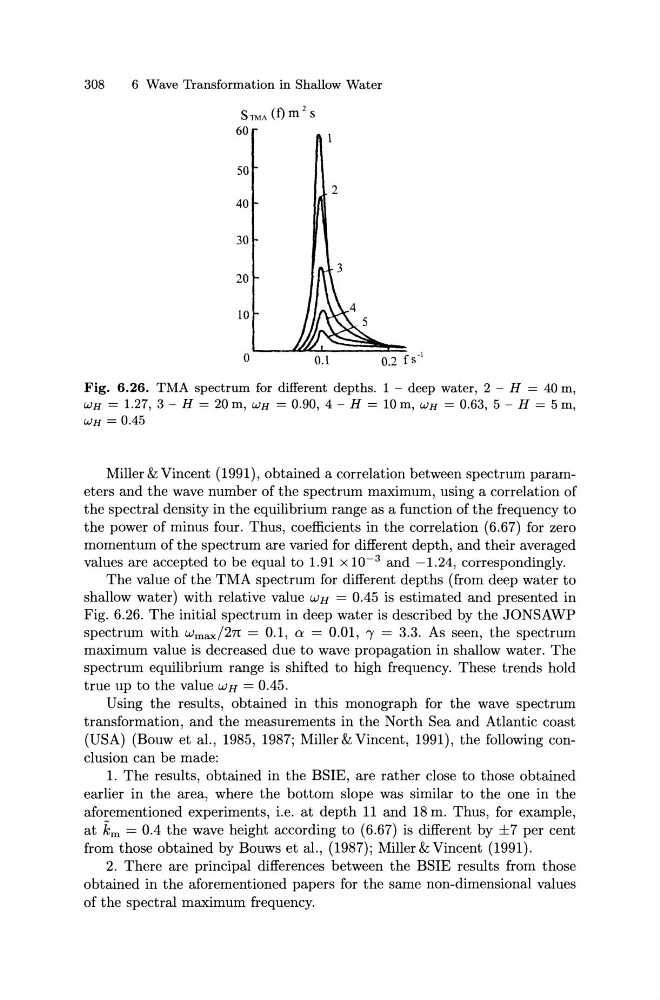
Fig. 6.26. TMA spectrum for different depths. 1 -deep water, 2- H = 40 m,
WH = 1.27, 3 - H = 20m, WH = 0.90, 4 - H = 10m, WH = 0.63, 5 - H = 5 m,
WH = 0.45
Miller & Vincent (1991), obtained a correlation between spectrum parameters and the wave number of the spectrum maximum, using a correlation of
the spectral density in the equilibrium range as a function of the frequency to
the power of minus four. Thus, coefficients in the correlation (6.67) for zero
momentum of the spectrum are varied for different depth, and their averaged
values are accepted to be equal to 1.91 x 10- 3 and -1.24, correspondingly.
The value of the TMA spectrum for different depths (from deep water to
shallow water) with relative value WH = 0.45 is estimated and presented in
Fig. 6.26. The initial spectrum in deep water is described by the JONSAWP
spectrum with Wmax/2n = 0.1, a = 0.01, ' "Y = 3.3. As seen, the spectrum
maximum value is decreased due to wave propagation in shallow water. The
spectrum equilibrium range is shifted to high frequency. These trends hold
true up to the value WH = 0.45.
Using the results, obtained in this monograph for the wave spectrum
transformation, and the measurements in the North Sea and Atlantic coast
(USA) (Bouw et al., 1985, 1987; Miller&Vincent, 1991), the following conclusion can be made:
1. The results, obtained in the BSIE, are rather close to those obtained
earlier in the area, where the bottom slope was similar to the one in the
aforementioned experiments, i.e. at depth 11 and 18 m. Thus, for example,
at km = 0.4 the wave height according to (6.67) is different by ±7 per cent
from those obtained by Bouws et al., (1987); Miller & Vincent (1991).
2. There are principal differences between the BSIE results from those
obtained in the aforementioned papers for the same non-dimensional values
of the spectral maximum frequency.
6 Wave Transformation in Shallow Water
SrMA (f) m
2 s
60
50
40
30
20
10
0
2
o.2 rs-l
Fig. 6.26. TMA spectrum for different depths. 1 -deep water, 2- H = 40 m,
WH = 1.27, 3 - H = 20m, WH = 0.90, 4 - H = 10m, WH = 0.63, 5 - H = 5 m,
WH = 0.45
Miller & Vincent (1991), obtained a correlation between spectrum parameters and the wave number of the spectrum maximum, using a correlation of
the spectral density in the equilibrium range as a function of the frequency to
the power of minus four. Thus, coefficients in the correlation (6.67) for zero
momentum of the spectrum are varied for different depth, and their averaged
values are accepted to be equal to 1.91 x 10- 3 and -1.24, correspondingly.
The value of the TMA spectrum for different depths (from deep water to
shallow water) with relative value WH = 0.45 is estimated and presented in
Fig. 6.26. The initial spectrum in deep water is described by the JONSAWP
spectrum with Wmax/2n = 0.1, a = 0.01, ' "Y = 3.3. As seen, the spectrum
maximum value is decreased due to wave propagation in shallow water. The
spectrum equilibrium range is shifted to high frequency. These trends hold
true up to the value WH = 0.45.
Using the results, obtained in this monograph for the wave spectrum
transformation, and the measurements in the North Sea and Atlantic coast
(USA) (Bouw et al., 1985, 1987; Miller&Vincent, 1991), the following conclusion can be made:
1. The results, obtained in the BSIE, are rather close to those obtained
earlier in the area, where the bottom slope was similar to the one in the
aforementioned experiments, i.e. at depth 11 and 18 m. Thus, for example,
at km = 0.4 the wave height according to (6.67) is different by ±7 per cent
from those obtained by Bouws et al., (1987); Miller & Vincent (1991).
2. There are principal differences between the BSIE results from those
obtained in the aforementioned papers for the same non-dimensional values
of the spectral maximum frequency.