

6.6 Black Sea International Experiment
307
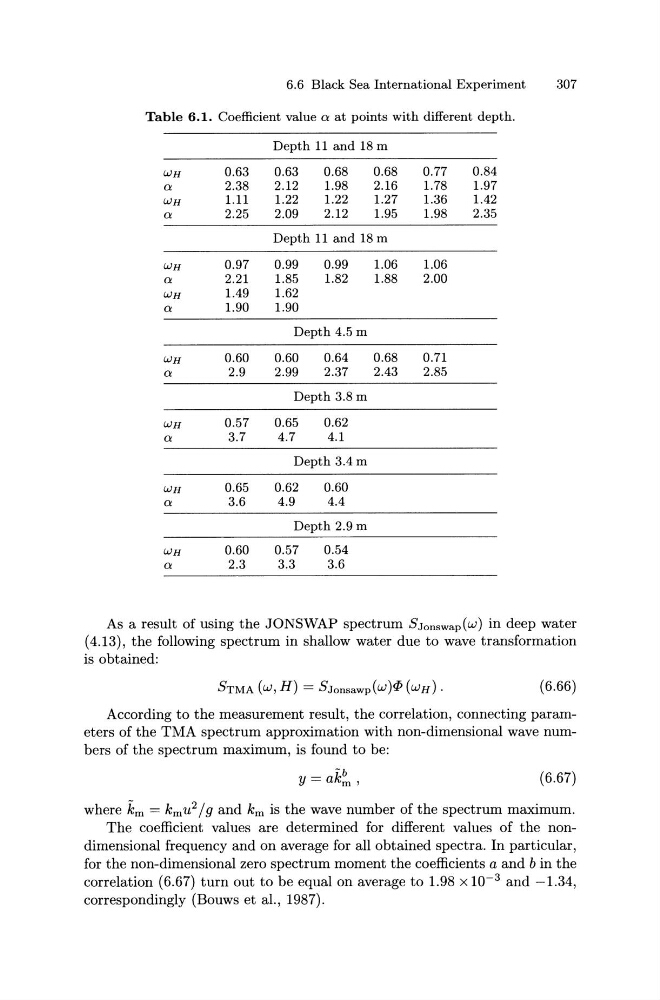
Table 6.1. Coefficient value a at points with different depth.
Depth 11 and 18 m
WH
0.63
0.63
0.68
0.68
0.77
0.84
a
2.38
2.12
1.98
2.16
1.78
1.97
WH
1.11
1.22
1.22
1.27
1.36
1.42
a
2.25
2.09
2.12
1.95
1.98
2.35
Depth 11 and 18 m
WH
0.97
0.99
0.99
1.06
1.06
a
2.21
1.85
1.82
1.88
2.00
WH
1.49
1.62
a
1.90
1.90
Depth 4.5 m
WH
0.60
0.60
0.64
0.68
0.71
a
2.9
2.99
2.37
2.43
2.85
Depth 3.8m
WH
0.57
0.65
0.62
a
3.7
4.7
4.1
Depth 3.4m
WH
0.65
0.62
0.60
a
3.6
4.9
4.4
Depth 2.9m
WH
0.60
0.57
0.54
a
2.3
3.3
3.6
As a result of using the JONSWAP spectrum SJonswap(w) in deep water
(4.13), the following spectrum in shallow water due to wave transformation
is obtained:
STMA (w,H) = SJonsawp(w)
According to the measurement result, the correlation, connecting parameters of the TMA spectrum approximation with non-dimensional wave numbers of the spectrum maximum, is found to be:
(6.67)
where km = km u 2 / g and km is the wave number of the spectrum maximum.
The coefficient values are determined for different values of the nondimensional frequency and on average for all obtained spectra. In particular,
for the non-dimensional zero spectrum moment the coefficients a and b in the
correlation (6.67) turn out to be equal on average to 1.98 x w- 3 and -1.34,
correspondingly (Bouws et al., 1987).
307
Table 6.1. Coefficient value a at points with different depth.
Depth 11 and 18 m
WH
0.63
0.63
0.68
0.68
0.77
0.84
a
2.38
2.12
1.98
2.16
1.78
1.97
WH
1.11
1.22
1.22
1.27
1.36
1.42
a
2.25
2.09
2.12
1.95
1.98
2.35
Depth 11 and 18 m
WH
0.97
0.99
0.99
1.06
1.06
a
2.21
1.85
1.82
1.88
2.00
WH
1.49
1.62
a
1.90
1.90
Depth 4.5 m
WH
0.60
0.60
0.64
0.68
0.71
a
2.9
2.99
2.37
2.43
2.85
Depth 3.8m
WH
0.57
0.65
0.62
a
3.7
4.7
4.1
Depth 3.4m
WH
0.65
0.62
0.60
a
3.6
4.9
4.4
Depth 2.9m
WH
0.60
0.57
0.54
a
2.3
3.3
3.6
As a result of using the JONSWAP spectrum SJonswap(w) in deep water
(4.13), the following spectrum in shallow water due to wave transformation
is obtained:
STMA (w,H) = SJonsawp(w)
According to the measurement result, the correlation, connecting parameters of the TMA spectrum approximation with non-dimensional wave numbers of the spectrum maximum, is found to be:
(6.67)
where km = km u 2 / g and km is the wave number of the spectrum maximum.
The coefficient values are determined for different values of the nondimensional frequency and on average for all obtained spectra. In particular,
for the non-dimensional zero spectrum moment the coefficients a and b in the
correlation (6.67) turn out to be equal on average to 1.98 x w- 3 and -1.34,
correspondingly (Bouws et al., 1987).