

S(ro) m
2 (rad s
1
f 1
0.30
3.8 m
a)
4.5 m
0.25
0.20
0.15
0.10
0.05
•, II m
' I
I
6.6 Black Sea International Experiment
309
3.8m
b)
2
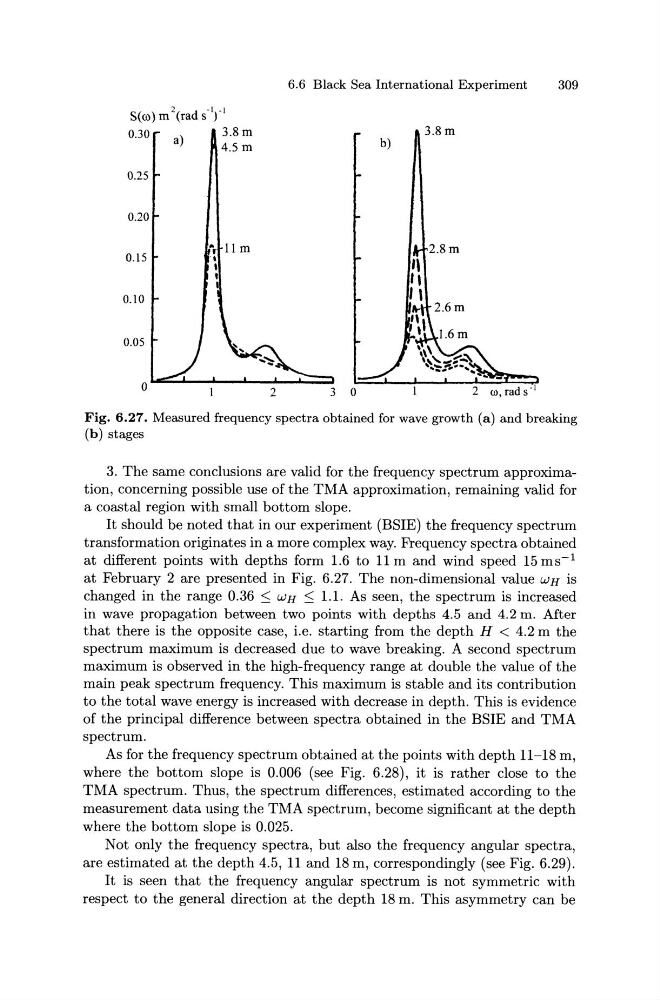
Fig. 6.27. Measured frequency spectra obtained for wave growth (a) and breaking
(b) stages
3. The same conclusions are valid for the frequency spectrum approximation, concerning possible use of the TMA approximation, remaining valid for
a coastal region with small bottom slope.
It should be noted that in our experiment (BSIE) the frequency spectrum
transformation originates in a more complex way. Frequency spectra obtained
at different points with depths form 1.6 to 11m and wind speed 15 ms- 1
at February 2 are presented in Fig. 6.27. The non-dimensional value WH is
changed in the range 0.36 _<:::: WH _<:::: 1.1. As seen, the spectrum is increased
in wave propagation between two points with depths 4.5 and 4.2 m. After
that there is the opposite case, i.e. starting from the depth H < 4.2 m the
spectrum maximum is decreased due to wave breaking. A second spectrum
maximum is observed in the high-frequency range at double the value of the
main peak spectrum frequency. This maximum is stable and its contribution
to the total wave energy is increased with decrease in depth. This is evidence
of the principal difference between spectra obtained in the BSIE and TMA
spectrum.
As for the frequency spectrum obtained at the points with depth 11-18 m,
where the bottom slope is 0.006 (see Fig. 6.28), it is rather close to the
TMA spectrum. Thus, the spectrum differences, estimated according to the
measurement data using the TMA spectrum, become significant at the depth
where the bottom slope is 0.025.
Not only the frequency spectra, but also the frequency angular spectra,
are estimated at the depth 4.5, 11 and 18m, correspondingly (see Fig. 6.29).
It is seen that the frequency angular spectrum is not symmetric with
respect to the general direction at the depth 18m. This asymmetry can be
2 (rad s
1
f 1
0.30
3.8 m
a)
4.5 m
0.25
0.20
0.15
0.10
0.05
•, II m
' I
I
6.6 Black Sea International Experiment
309
3.8m
b)
2
Fig. 6.27. Measured frequency spectra obtained for wave growth (a) and breaking
(b) stages
3. The same conclusions are valid for the frequency spectrum approximation, concerning possible use of the TMA approximation, remaining valid for
a coastal region with small bottom slope.
It should be noted that in our experiment (BSIE) the frequency spectrum
transformation originates in a more complex way. Frequency spectra obtained
at different points with depths form 1.6 to 11m and wind speed 15 ms- 1
at February 2 are presented in Fig. 6.27. The non-dimensional value WH is
changed in the range 0.36 _<:::: WH _<:::: 1.1. As seen, the spectrum is increased
in wave propagation between two points with depths 4.5 and 4.2 m. After
that there is the opposite case, i.e. starting from the depth H < 4.2 m the
spectrum maximum is decreased due to wave breaking. A second spectrum
maximum is observed in the high-frequency range at double the value of the
main peak spectrum frequency. This maximum is stable and its contribution
to the total wave energy is increased with decrease in depth. This is evidence
of the principal difference between spectra obtained in the BSIE and TMA
spectrum.
As for the frequency spectrum obtained at the points with depth 11-18 m,
where the bottom slope is 0.006 (see Fig. 6.28), it is rather close to the
TMA spectrum. Thus, the spectrum differences, estimated according to the
measurement data using the TMA spectrum, become significant at the depth
where the bottom slope is 0.025.
Not only the frequency spectra, but also the frequency angular spectra,
are estimated at the depth 4.5, 11 and 18m, correspondingly (see Fig. 6.29).
It is seen that the frequency angular spectrum is not symmetric with
respect to the general direction at the depth 18m. This asymmetry can be