

206
5 Wave Evolution in Non-uniform Currents in Deep Water
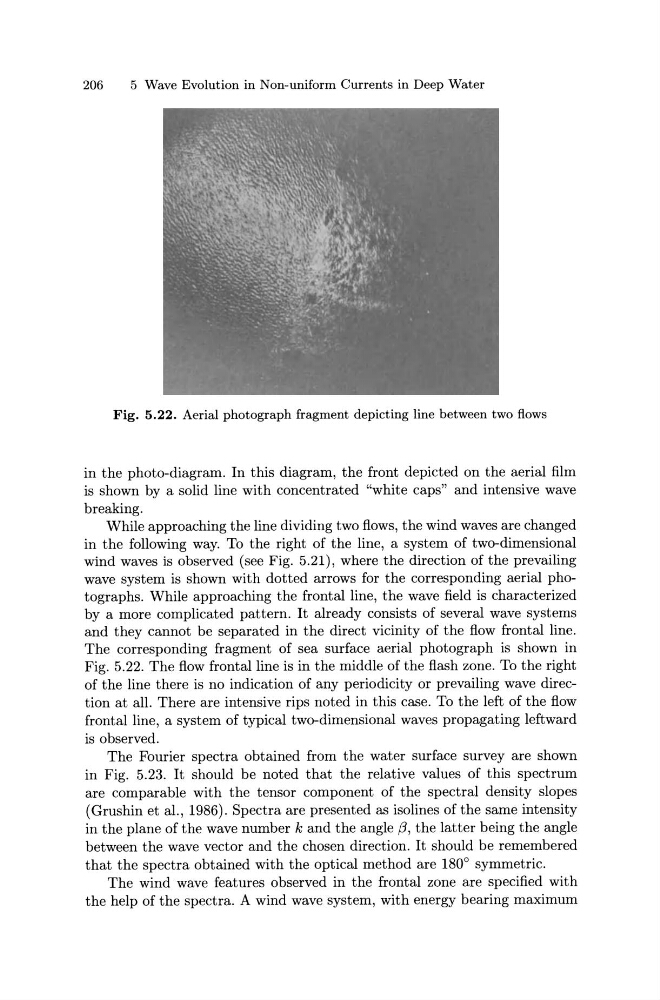
Fig. 5.22. Aerial photograph fragment depicting line between two flows
in the photo-diagram. In this diagram, the front depicted on the aerial film
is shown by a solid line with concentrated "white caps" and intensive wave
breaking.
While approaching the line dividing two flows, the wind waves are changed
in the following way. To the right of the line, a system of two-dimensional
wind waves is observed (see Fig. 5.21), where the direction of the prevailing
wave system is shown with dotted arrows for the corresponding aerial photographs. While approaching the frontal line, the wave field is characterized
by a more complicated pattern. It already consists of several wave systems
and they cannot be separated in the direct vicinity of the flow frontal line.
The corresponding fragment of sea surface aerial photograph is shown in
Fig. 5.22. The flow frontal line is in the middle of the flash zone. To the right
of the line there is no indication of any periodicity or prevailing wave direction at all. There are intensive rips noted in this case. To the left of the flow
frontal line, a system of typical two-dimensional waves propagating leftward
is observed.
The Fourier spectra obtained from the water surface survey are shown
in Fig. 5.23. It should be noted that the relative values of this spectrum
are comparable with the tensor component of the spectral density slopes
( Grushin et al., 1986). Spectra are presented as isolines of the same intensity
in the plane of the wave number k and the angle {3, the latter being the angle
between the wave vector and the chosen direction. It should be remembered
that the spectra obtained with the optical method are 180° symmetric.
The wind wave features observed in the frontal zone are specified with
the help of the spectra. A wind wave system, with energy bearing maximum
5 Wave Evolution in Non-uniform Currents in Deep Water
Fig. 5.22. Aerial photograph fragment depicting line between two flows
in the photo-diagram. In this diagram, the front depicted on the aerial film
is shown by a solid line with concentrated "white caps" and intensive wave
breaking.
While approaching the line dividing two flows, the wind waves are changed
in the following way. To the right of the line, a system of two-dimensional
wind waves is observed (see Fig. 5.21), where the direction of the prevailing
wave system is shown with dotted arrows for the corresponding aerial photographs. While approaching the frontal line, the wave field is characterized
by a more complicated pattern. It already consists of several wave systems
and they cannot be separated in the direct vicinity of the flow frontal line.
The corresponding fragment of sea surface aerial photograph is shown in
Fig. 5.22. The flow frontal line is in the middle of the flash zone. To the right
of the line there is no indication of any periodicity or prevailing wave direction at all. There are intensive rips noted in this case. To the left of the flow
frontal line, a system of typical two-dimensional waves propagating leftward
is observed.
The Fourier spectra obtained from the water surface survey are shown
in Fig. 5.23. It should be noted that the relative values of this spectrum
are comparable with the tensor component of the spectral density slopes
( Grushin et al., 1986). Spectra are presented as isolines of the same intensity
in the plane of the wave number k and the angle {3, the latter being the angle
between the wave vector and the chosen direction. It should be remembered
that the spectra obtained with the optical method are 180° symmetric.
The wind wave features observed in the frontal zone are specified with
the help of the spectra. A wind wave system, with energy bearing maximum