

5.7 Wind Wave Transformation in Cross-Velocity Shear Current
207
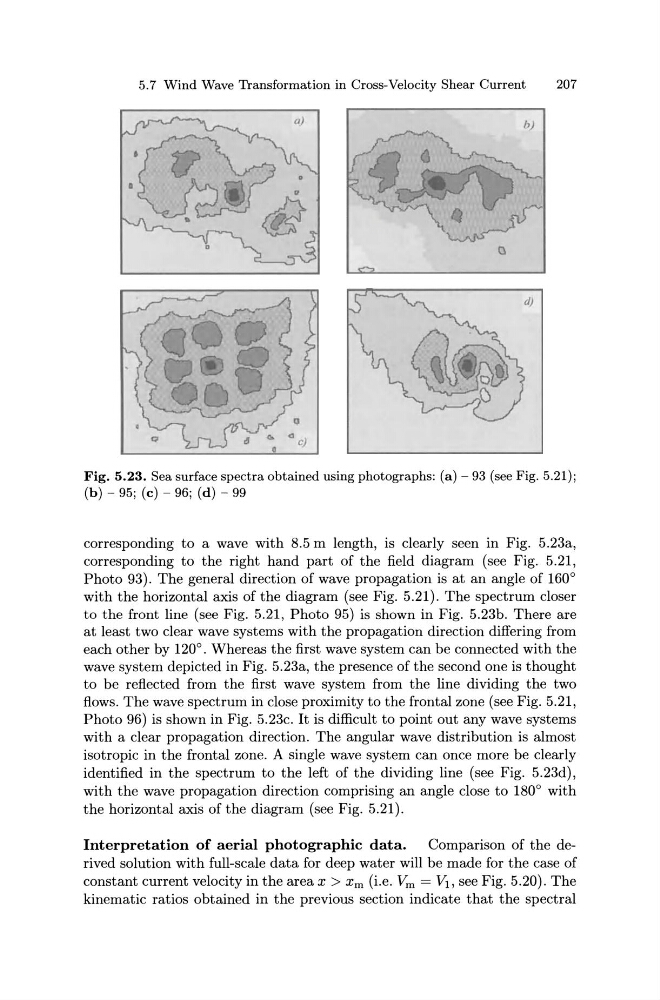
Fig. 5.23. Sea surface spectra obtained using photographs: (a) - 93 (see Fig. 5.21);
(b)- 95; (c) - 96; (d) - 99
corresponding to a wave with 8.5 m length, is clearly seen in Fig. 5.23a,
corresponding to the right hand part of the field diagram (see Fig. 5.21,
Photo 93). The general direction of wave propagation is at an angle of 160°
with the horizontal axis of the diagram (see Fig. 5.21) . The spectrum closer
to the front line (see Fig. 5.21, Photo 95) is shown in Fig. 5.23b. There are
at least two clear wave systems with the propagation direction differing from
each other by 120°. Whereas the first wave system can be connected with the
wave system depicted in Fig. 5.23a, the presence of the second one is thought
to be reflected from the first wave system from the line dividing the two
flows. The wave spectrum in close proximity to the frontal zone (see Fig. 5.21,
Photo 96) is shown in Fig. 5.23c. It is difficult to point out any wave systems
with a clear propagation direction. The angular wave distribution is almost
isotropic in the frontal zone. A single wave system can once more be clearly
identified in the spectrum to the left of the dividing line (see Fig. 5.23d) ,
with the wave propagation direction comprising an angle close to 180° with
the horizontal axis of the diagram (see Fig. 5.21).
Interpretation of aerial photographic data.
Comparison of the derived solution with full-scale data for deep water will be made for the case of
constant current velocity in the area x > Xm (i.e. Vm = V1 , see Fig. 5.20). The
kinematic ratios obtained in the previous section indicate that the spectral
207
Fig. 5.23. Sea surface spectra obtained using photographs: (a) - 93 (see Fig. 5.21);
(b)- 95; (c) - 96; (d) - 99
corresponding to a wave with 8.5 m length, is clearly seen in Fig. 5.23a,
corresponding to the right hand part of the field diagram (see Fig. 5.21,
Photo 93). The general direction of wave propagation is at an angle of 160°
with the horizontal axis of the diagram (see Fig. 5.21) . The spectrum closer
to the front line (see Fig. 5.21, Photo 95) is shown in Fig. 5.23b. There are
at least two clear wave systems with the propagation direction differing from
each other by 120°. Whereas the first wave system can be connected with the
wave system depicted in Fig. 5.23a, the presence of the second one is thought
to be reflected from the first wave system from the line dividing the two
flows. The wave spectrum in close proximity to the frontal zone (see Fig. 5.21,
Photo 96) is shown in Fig. 5.23c. It is difficult to point out any wave systems
with a clear propagation direction. The angular wave distribution is almost
isotropic in the frontal zone. A single wave system can once more be clearly
identified in the spectrum to the left of the dividing line (see Fig. 5.23d) ,
with the wave propagation direction comprising an angle close to 180° with
the horizontal axis of the diagram (see Fig. 5.21).
Interpretation of aerial photographic data.
Comparison of the derived solution with full-scale data for deep water will be made for the case of
constant current velocity in the area x > Xm (i.e. Vm = V1 , see Fig. 5.20). The
kinematic ratios obtained in the previous section indicate that the spectral