

5.3 Spectral Model of Rips
171
3
2
0
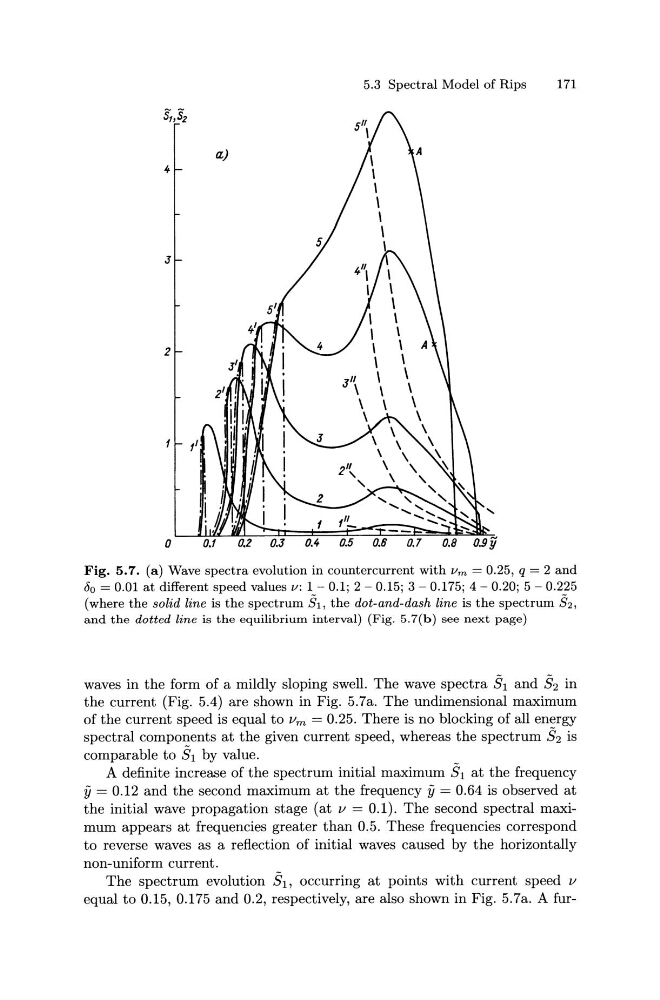
Fig. 5.7. (a) Wave spectra evolution in countercurrent with Vrn = 0.25, q = 2 and
Do= 0.01 at different speed values v: 1- 0.1; 2- 0.15; 3- 0.175; 4- 0.20; 5- 0.225
(where the solid line is the spectrum fh, the dot-and-dash line is the spectrum fh,
and the dotted line is the equilibrium interval) (Fig. 5.7(b) see next page)
waves in the form of a mildly sloping swell. The wave spectra [h and S2 in
the current (Fig. 5.4) are shown in Fig. 5.7a. The undimensional maximum
of the current speed is equal to Vm = 0.25. There is no blocking of all energy
spectral components at the given current speed, whereas the spectrum S2 is
comparable to S1 by value.
A definite increase of the spectrum initial maximum S1 at the frequency
fj = 0.12 and the second maximum at the frequency fj = 0.64 is observed at
the initial wave propagation stage (at v = 0.1). The second spectral maximum appears at frequencies greater than 0.5. These frequencies correspond
to reverse waves as a reflection of initial waves caused by the horizontally
non-uniform current.
The spectrum evolution S1 , occurring at points with current speed v
equal to 0.15, 0.175 and 0.2, respectively, are also shown in Fig. 5. 7a. A fur-
171
3
2
0
Fig. 5.7. (a) Wave spectra evolution in countercurrent with Vrn = 0.25, q = 2 and
Do= 0.01 at different speed values v: 1- 0.1; 2- 0.15; 3- 0.175; 4- 0.20; 5- 0.225
(where the solid line is the spectrum fh, the dot-and-dash line is the spectrum fh,
and the dotted line is the equilibrium interval) (Fig. 5.7(b) see next page)
waves in the form of a mildly sloping swell. The wave spectra [h and S2 in
the current (Fig. 5.4) are shown in Fig. 5.7a. The undimensional maximum
of the current speed is equal to Vm = 0.25. There is no blocking of all energy
spectral components at the given current speed, whereas the spectrum S2 is
comparable to S1 by value.
A definite increase of the spectrum initial maximum S1 at the frequency
fj = 0.12 and the second maximum at the frequency fj = 0.64 is observed at
the initial wave propagation stage (at v = 0.1). The second spectral maximum appears at frequencies greater than 0.5. These frequencies correspond
to reverse waves as a reflection of initial waves caused by the horizontally
non-uniform current.
The spectrum evolution S1 , occurring at points with current speed v
equal to 0.15, 0.175 and 0.2, respectively, are also shown in Fig. 5. 7a. A fur-