

172
5 Wave Evolution in Non-uniform Currents in Deep Water
:S,
4
2
0
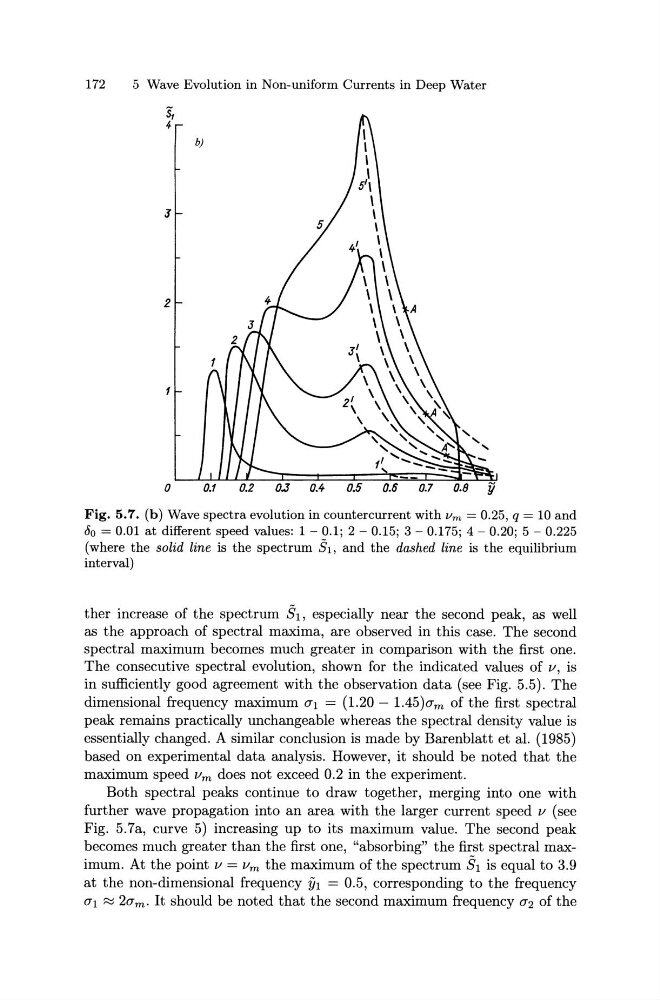
Fig. 5.7. (b) Wave spectra evolution in countercurrent with v= = 0.25, q = 10 and
80 = 0.01 at different speed values: 1 - 0.1; 2 - 0.15; 3- 0.175; 4 - 0.20; 5 - 0.225
(where the solid line is the spectrum fh, and the dashed line is the equilibrium
interval)
ther increase of the spectrum Eh , especially near the second peak, as well
as the approach of spectral maxima, are observed in this case. The second
spectral maximum becomes much greater in comparison with the first one.
The consecutive spectral evolution, shown for the indicated values of v, is
in sufficiently good agreement with the observation data (see Fig. 5.5). The
dimensional frequency maximum 0"1 = (1.20- 1.45)am of the first spectral
peak remains practically unchangeable whereas the spectral density value is
essentially changed. A similar conclusion is made by Barenblatt et al. (1985)
based on experimental data analysis. However, it should be noted that the
maximum speed Vm does not exceed 0.2 in the experiment.
Both spectral peaks continue to draw together, merging into one with
further wave propagation into an area with the larger current speed v (see
Fig. 5.7a, curve 5) increasing up to its maximum value. The second peak
becomes much greater than the first one, "absorbing" the first spectral maximum. At the point v = Vm the maximum of the spectrum Eh is equal to 3.9
at the non-dimensional frequency iii = 0.5, corresponding to the frequency
0"1 ~ 20"m· It should be noted that the second maximum frequency 0"2 of the
5 Wave Evolution in Non-uniform Currents in Deep Water
:S,
4
2
0
Fig. 5.7. (b) Wave spectra evolution in countercurrent with v= = 0.25, q = 10 and
80 = 0.01 at different speed values: 1 - 0.1; 2 - 0.15; 3- 0.175; 4 - 0.20; 5 - 0.225
(where the solid line is the spectrum fh, and the dashed line is the equilibrium
interval)
ther increase of the spectrum Eh , especially near the second peak, as well
as the approach of spectral maxima, are observed in this case. The second
spectral maximum becomes much greater in comparison with the first one.
The consecutive spectral evolution, shown for the indicated values of v, is
in sufficiently good agreement with the observation data (see Fig. 5.5). The
dimensional frequency maximum 0"1 = (1.20- 1.45)am of the first spectral
peak remains practically unchangeable whereas the spectral density value is
essentially changed. A similar conclusion is made by Barenblatt et al. (1985)
based on experimental data analysis. However, it should be noted that the
maximum speed Vm does not exceed 0.2 in the experiment.
Both spectral peaks continue to draw together, merging into one with
further wave propagation into an area with the larger current speed v (see
Fig. 5.7a, curve 5) increasing up to its maximum value. The second peak
becomes much greater than the first one, "absorbing" the first spectral maximum. At the point v = Vm the maximum of the spectrum Eh is equal to 3.9
at the non-dimensional frequency iii = 0.5, corresponding to the frequency
0"1 ~ 20"m· It should be noted that the second maximum frequency 0"2 of the