

170
5 Wave Evolution in Non-uniform Currents in Deep Water
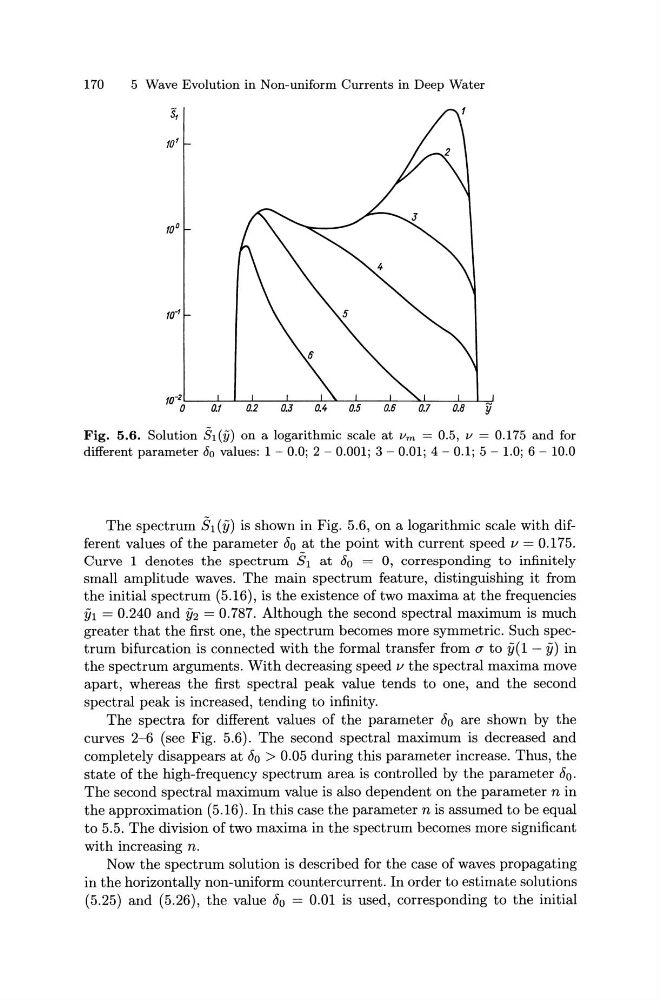
Fig. 5.6. Solution St (iJ) on a logarithmic scale at 1/m = 0.5, v = 0.175 and for
different parameter Do values: 1 ~ 0.0; 2 ~ 0.001; 3 ~ 0.01; 4 ~ 0.1; 5 ~ 1.0; 6 ~ 10.0
The spectrum Eh (y) is shown in Fig. 5.6, on a logarithmic scale with different values of the parameter S0 at the point with current speed v = 0.175.
Curve 1 denotes the spectrum Eh at Do = 0, corresponding to infinitely
small amplitude waves. The main spectrum feature, distinguishing it from
the initial spectrum (5.16), is the existence of two maxima at the frequencies
fj1 = 0.240 and Y2 = 0. 787. Although the second spectral maximum is much
greater that the first one, the spectrum becomes more symmetric. Such spectrum bifurcation is connected with the formal transfer from 0' to y(1- y) in
the spectrum arguments. With decreasing speed v the spectral maxima move
apart, whereas the first spectral peak value tends to one, and the second
spectral peak is increased, tending to infinity.
The spectra for different values of the parameter S0 are shown by the
curves 2~6 (see Fig. 5.6). The second spectral maximum is decreased and
completely disappears at S0 > 0.05 during this parameter increase. Thus, the
state of the high-frequency spectrum area is controlled by the parameter 60 .
The second spectral maximum value is also dependent on the parameter n in
the approximation (5.16). In this case the parameter n is assumed to be equal
to 5.5. The division of two maxima in the spectrum becomes more significant
with increasing n.
Now the spectrum solution is described for the case of waves propagating
in the horizontally non-uniform countercurrent. In order to estimate solutions
(5.25) and (5.26), the value Oo = 0.01 is used, corresponding to the initial
5 Wave Evolution in Non-uniform Currents in Deep Water
Fig. 5.6. Solution St (iJ) on a logarithmic scale at 1/m = 0.5, v = 0.175 and for
different parameter Do values: 1 ~ 0.0; 2 ~ 0.001; 3 ~ 0.01; 4 ~ 0.1; 5 ~ 1.0; 6 ~ 10.0
The spectrum Eh (y) is shown in Fig. 5.6, on a logarithmic scale with different values of the parameter S0 at the point with current speed v = 0.175.
Curve 1 denotes the spectrum Eh at Do = 0, corresponding to infinitely
small amplitude waves. The main spectrum feature, distinguishing it from
the initial spectrum (5.16), is the existence of two maxima at the frequencies
fj1 = 0.240 and Y2 = 0. 787. Although the second spectral maximum is much
greater that the first one, the spectrum becomes more symmetric. Such spectrum bifurcation is connected with the formal transfer from 0' to y(1- y) in
the spectrum arguments. With decreasing speed v the spectral maxima move
apart, whereas the first spectral peak value tends to one, and the second
spectral peak is increased, tending to infinity.
The spectra for different values of the parameter S0 are shown by the
curves 2~6 (see Fig. 5.6). The second spectral maximum is decreased and
completely disappears at S0 > 0.05 during this parameter increase. Thus, the
state of the high-frequency spectrum area is controlled by the parameter 60 .
The second spectral maximum value is also dependent on the parameter n in
the approximation (5.16). In this case the parameter n is assumed to be equal
to 5.5. The division of two maxima in the spectrum becomes more significant
with increasing n.
Now the spectrum solution is described for the case of waves propagating
in the horizontally non-uniform countercurrent. In order to estimate solutions
(5.25) and (5.26), the value Oo = 0.01 is used, corresponding to the initial