

4.3 Wave Energy Dissipation in Deep Water
129
were not determined by the integral parameters of the whole spectrum. He
came to the conclusion that wind wave energy input, dissipation and nonlinear interaction were of the same size in the spectrum equilibrium range.
Using the wave energy balance equation he found that the dissipation should
depend cubically on the spectrum:
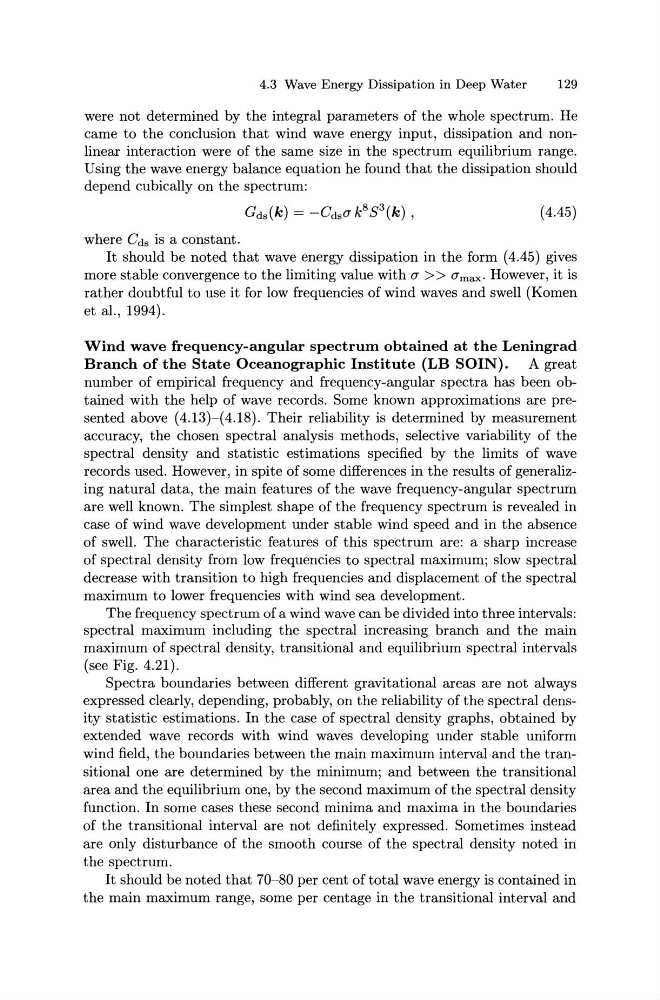
(4.45)
where Cds is a constant.
It should be noted that wave energy dissipation in the form ( 4.45) gives
more stable convergence to the limiting value with a>> amax· However, it is
rather doubtful to use it for low frequencies of wind waves and swell (Komen
et al., 1994).
Wind wave frequency-angular spectrum obtained at the Leningrad
Branch of the State Oceanographic Institute {LB SOIN). A great
number of empirical frequency and frequency-angular spectra has been obtained with the help of wave records. Some known approximations are presented above (4.13)-(4.18). Their reliability is determined by measurement
accuracy, the chosen spectral analysis methods, selective variability of the
spectral density and statistic estimations specified by the limits of wave
records used. However, in spite of some differences in the results of generalizing natural data, the main features of the wave frequency-angular spectrum
are well known. The simplest shape of the frequency spectrum is revealed in
case of wind wave development under stable wind speed and in the absence
of swell. The characteristic features of this spectrum are: a sharp increase
of spectral density from low frequencies to spectral maximum; slow spectral
decrease with transition to high frequencies and displacement of the spectral
maximum to lower frequencies with wind sea development.
The frequency spectrum of a wind wave can be divided into three intervals:
spectral maximum including the spectral increasing branch and the main
maximum of spectral density, transitional and equilibrium spectral intervals
(see Fig. 4.21).
Spectra boundaries between different gravitational areas are not always
expressed clearly, depending, probably, on the reliability of the spectral density statistic estimations. In the case of spectral density graphs, obtained by
extended wave records with wind waves developing under stable uniform
wind field, the boundaries between the main maximum interval and the transitional one are determined by the minimum; and between the transitional
area and the equilibrium one, by the second maximum of the spectral density
function. In some cases these second minima and maxima in the boundaries
of the transitional interval are not definitely expressed. Sometimes instead
are only disturbance of the smooth course of the spectral density noted in
the spectrum.
It should be noted that 70-80 per cent of total wave energy is contained in
the main maximum range, some per centage in the transitional interval and
129
were not determined by the integral parameters of the whole spectrum. He
came to the conclusion that wind wave energy input, dissipation and nonlinear interaction were of the same size in the spectrum equilibrium range.
Using the wave energy balance equation he found that the dissipation should
depend cubically on the spectrum:
(4.45)
where Cds is a constant.
It should be noted that wave energy dissipation in the form ( 4.45) gives
more stable convergence to the limiting value with a>> amax· However, it is
rather doubtful to use it for low frequencies of wind waves and swell (Komen
et al., 1994).
Wind wave frequency-angular spectrum obtained at the Leningrad
Branch of the State Oceanographic Institute {LB SOIN). A great
number of empirical frequency and frequency-angular spectra has been obtained with the help of wave records. Some known approximations are presented above (4.13)-(4.18). Their reliability is determined by measurement
accuracy, the chosen spectral analysis methods, selective variability of the
spectral density and statistic estimations specified by the limits of wave
records used. However, in spite of some differences in the results of generalizing natural data, the main features of the wave frequency-angular spectrum
are well known. The simplest shape of the frequency spectrum is revealed in
case of wind wave development under stable wind speed and in the absence
of swell. The characteristic features of this spectrum are: a sharp increase
of spectral density from low frequencies to spectral maximum; slow spectral
decrease with transition to high frequencies and displacement of the spectral
maximum to lower frequencies with wind sea development.
The frequency spectrum of a wind wave can be divided into three intervals:
spectral maximum including the spectral increasing branch and the main
maximum of spectral density, transitional and equilibrium spectral intervals
(see Fig. 4.21).
Spectra boundaries between different gravitational areas are not always
expressed clearly, depending, probably, on the reliability of the spectral density statistic estimations. In the case of spectral density graphs, obtained by
extended wave records with wind waves developing under stable uniform
wind field, the boundaries between the main maximum interval and the transitional one are determined by the minimum; and between the transitional
area and the equilibrium one, by the second maximum of the spectral density
function. In some cases these second minima and maxima in the boundaries
of the transitional interval are not definitely expressed. Sometimes instead
are only disturbance of the smooth course of the spectral density noted in
the spectrum.
It should be noted that 70-80 per cent of total wave energy is contained in
the main maximum range, some per centage in the transitional interval and