

70
55
60
65
70
75
80
85
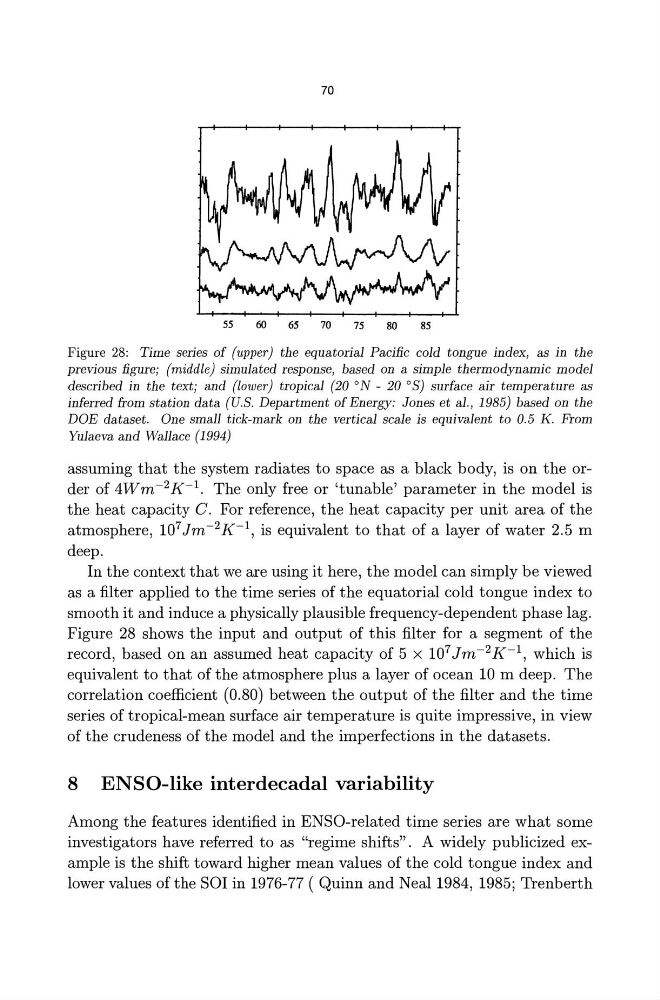
Figure 28: Time series of (upper) the equatorial Pacific cold tongue index, as in the
previous figure; (middle) simulated response, based on a simple thermodynamic model
described in the text; and (lower) tropical (20 oN - 20 OS) surface air temperature as
inferred from station data (U.S. Department of Energy: Jones et al., 1985) based on the
DOE dataset. One small tick-mark on the vertical scale is equivalent to 0.5 K. From
Yulaeva and Wallace (1994)
assuming that the system radiates to space as a black body, is on the order of 4Wm- 2 K-l. The only free or 'tunable' parameter in the model is
the heat capacity C. For reference, the heat capacity per unit area of the
atmosphere, 10 7 Jm- 2 K-l, is equivalent to that of a layer of water 2.5 m
deep.
In the context that we are using it here, the model can simply be viewed
as a filter applied to the time series of the equatorial cold tongue index to
smooth it and induce a physically plausible frequency-dependent phase lag.
Figure 28 shows the input and output of this filter for a segment of the
record, based on an assumed heat capacity of 5 x 10 7 Jm- 2 K-l, which is
equivalent to that of the atmosphere plus a layer of ocean 10 m deep. The
correlation coefficient (0.80) between the output of the filter and the time
series of tropical-mean surface air temperature is quite impressive, in view
of the crudeness of the model and the imperfections in the datasets.
8 ENSO-like interdecadal variability
Among the features identified in EN SO-related time series are what some
investigators have referred to as "regime shifts". A widely publicized example is the shift toward higher mean values of the cold tongue index and
lower values of the SOl in 1976-77 ( Quinn and Neal 1984, 1985; Trenberth
55
60
65
70
75
80
85
Figure 28: Time series of (upper) the equatorial Pacific cold tongue index, as in the
previous figure; (middle) simulated response, based on a simple thermodynamic model
described in the text; and (lower) tropical (20 oN - 20 OS) surface air temperature as
inferred from station data (U.S. Department of Energy: Jones et al., 1985) based on the
DOE dataset. One small tick-mark on the vertical scale is equivalent to 0.5 K. From
Yulaeva and Wallace (1994)
assuming that the system radiates to space as a black body, is on the order of 4Wm- 2 K-l. The only free or 'tunable' parameter in the model is
the heat capacity C. For reference, the heat capacity per unit area of the
atmosphere, 10 7 Jm- 2 K-l, is equivalent to that of a layer of water 2.5 m
deep.
In the context that we are using it here, the model can simply be viewed
as a filter applied to the time series of the equatorial cold tongue index to
smooth it and induce a physically plausible frequency-dependent phase lag.
Figure 28 shows the input and output of this filter for a segment of the
record, based on an assumed heat capacity of 5 x 10 7 Jm- 2 K-l, which is
equivalent to that of the atmosphere plus a layer of ocean 10 m deep. The
correlation coefficient (0.80) between the output of the filter and the time
series of tropical-mean surface air temperature is quite impressive, in view
of the crudeness of the model and the imperfections in the datasets.
8 ENSO-like interdecadal variability
Among the features identified in EN SO-related time series are what some
investigators have referred to as "regime shifts". A widely publicized example is the shift toward higher mean values of the cold tongue index and
lower values of the SOl in 1976-77 ( Quinn and Neal 1984, 1985; Trenberth