

71
20s ..l..,.· ... b;:",.....~-4..:.:::.:..:~~p;::::~~4!~~
120E 140E 160E 180 160W 140W 120W lOOW 80W
60N
40N
o
20S~~ . . ~--~-L~--~--.-~~~~~~
120E 140E 160E 180 I60W 140W 120W IOOW 80W
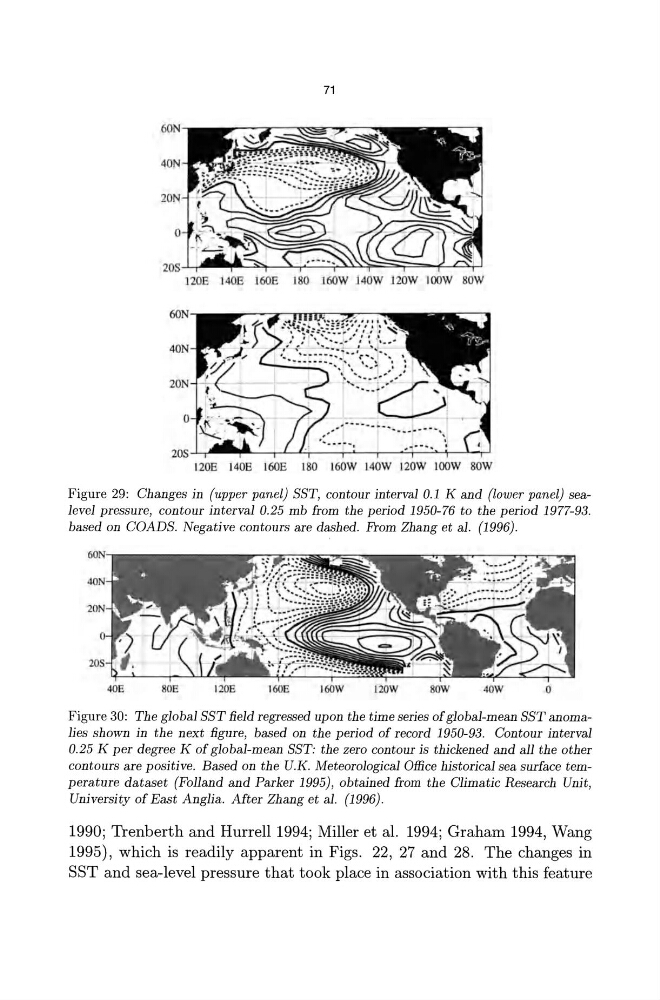
Figure 29: Changes in (upper panel) SST, contour interval 0.1 K and (lower panel) sealevel pressure, contour interval 0.25 mb from the period 1950-76 to the period 1977-93.
based on COADS. Negative contours are dashed. From Zhang et al. (1996) .
40E
80E
120E
I60E
I60W
120W
sow
40W
o
Figure 30: The global SST field regressed upon the time series of global-mean SST anomalies shown in the next figure, based on the period of record 1950-93. Contour interval
0.25 K per degree K of global-mean SST: the zero contour is thickened and all the other
contours are positive. Based on the U.K. Meteorological Office historical sea surface temperature dataset (Folland and Parker 1995), obtained from the Climatic Research Unit,
University of East Anglia. After Zhang et al. (1996).
1990; Trenberth and Hurrell 1994; Miller et al. 1994; Graham 1994, Wang
1995) , which is readily apparent in Figs. 22, 27 a nd 28. The changes in
SST and sea-level pressure that took place in association with this feature
20s ..l..,.· ... b;:",.....~-4..:.:::.:..:~~p;::::~~4!~~
120E 140E 160E 180 160W 140W 120W lOOW 80W
60N
40N
o
20S~~ . . ~--~-L~--~--.-~~~~~~
120E 140E 160E 180 I60W 140W 120W IOOW 80W
Figure 29: Changes in (upper panel) SST, contour interval 0.1 K and (lower panel) sealevel pressure, contour interval 0.25 mb from the period 1950-76 to the period 1977-93.
based on COADS. Negative contours are dashed. From Zhang et al. (1996) .
40E
80E
120E
I60E
I60W
120W
sow
40W
o
Figure 30: The global SST field regressed upon the time series of global-mean SST anomalies shown in the next figure, based on the period of record 1950-93. Contour interval
0.25 K per degree K of global-mean SST: the zero contour is thickened and all the other
contours are positive. Based on the U.K. Meteorological Office historical sea surface temperature dataset (Folland and Parker 1995), obtained from the Climatic Research Unit,
University of East Anglia. After Zhang et al. (1996).
1990; Trenberth and Hurrell 1994; Miller et al. 1994; Graham 1994, Wang
1995) , which is readily apparent in Figs. 22, 27 a nd 28. The changes in
SST and sea-level pressure that took place in association with this feature