

68
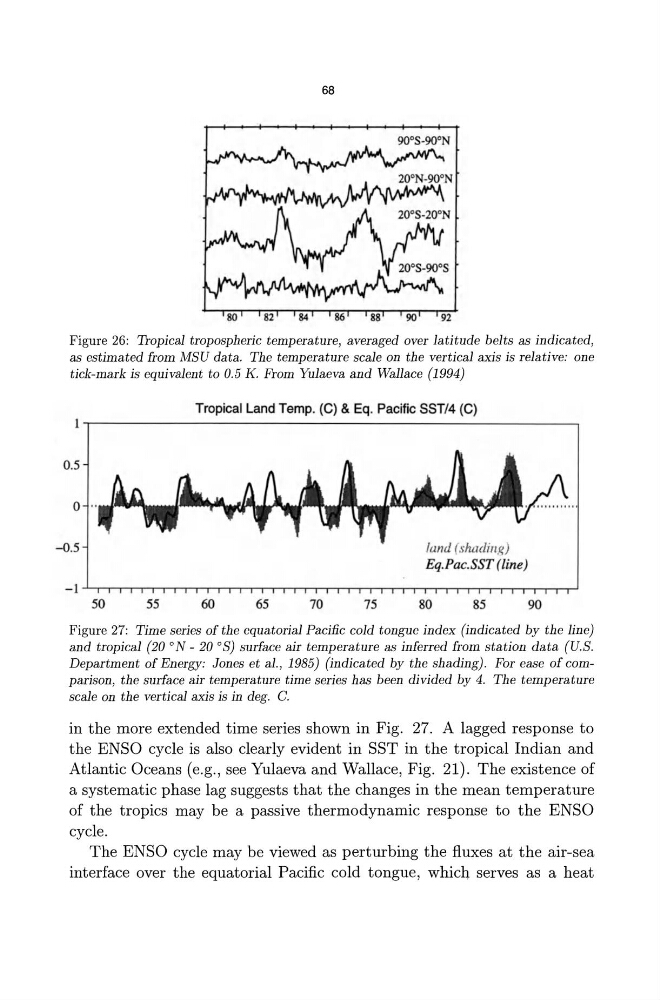
Figure 26 : Tropical tropospheric temperature, averaged over latitude belts as indicated,
as estimated from MSU data. The temperature scale on the vertical axis is relative: one
tick-mark is equivalent to 0.5 K. From Yulaeva and Wallace (1994)
0.5
o
-0.5
50
55
Tropical Land Temp. (C) & Eq. Pacific SST/4 (C)
60
65
70
75
land (shading)
Eq. Pac. SST (line)
80
85
90
Figure 27: Time series of the equatorial Pacific cold tongue index (indicated by the line)
and tropical (20 0 N - 20 O S) surface air temperature as inferred from station data (U.S.
Department of Energy: Jones et aI., 1985) (indicated by the shading). For ease of comparison, the surface air temperature time series has been divided by 4. The temperature
scale on the vertical axis is in deg. C.
in the more extended time series shown in Fig. 27. A lagged response to
the ENSO cycle is also clearly evident in SST in the tropical Indian and
Atlantic Oceans (e.g. , see Yulaeva and Wallace, Fig. 21). The existence of
a systematic phase lag suggests that the changes in the mean temperature
of the tropics may be a passive thermodynamic response to the ENSO
cycle.
The ENSO cycle may be viewed as perturbing the fluxes at the air-sea
interface over the equatorial Pacific cold tongue, which serves as a heat
Figure 26 : Tropical tropospheric temperature, averaged over latitude belts as indicated,
as estimated from MSU data. The temperature scale on the vertical axis is relative: one
tick-mark is equivalent to 0.5 K. From Yulaeva and Wallace (1994)
0.5
o
-0.5
50
55
Tropical Land Temp. (C) & Eq. Pacific SST/4 (C)
60
65
70
75
land (shading)
Eq. Pac. SST (line)
80
85
90
Figure 27: Time series of the equatorial Pacific cold tongue index (indicated by the line)
and tropical (20 0 N - 20 O S) surface air temperature as inferred from station data (U.S.
Department of Energy: Jones et aI., 1985) (indicated by the shading). For ease of comparison, the surface air temperature time series has been divided by 4. The temperature
scale on the vertical axis is in deg. C.
in the more extended time series shown in Fig. 27. A lagged response to
the ENSO cycle is also clearly evident in SST in the tropical Indian and
Atlantic Oceans (e.g. , see Yulaeva and Wallace, Fig. 21). The existence of
a systematic phase lag suggests that the changes in the mean temperature
of the tropics may be a passive thermodynamic response to the ENSO
cycle.
The ENSO cycle may be viewed as perturbing the fluxes at the air-sea
interface over the equatorial Pacific cold tongue, which serves as a heat