

67
80
82
84
86
88
90
92
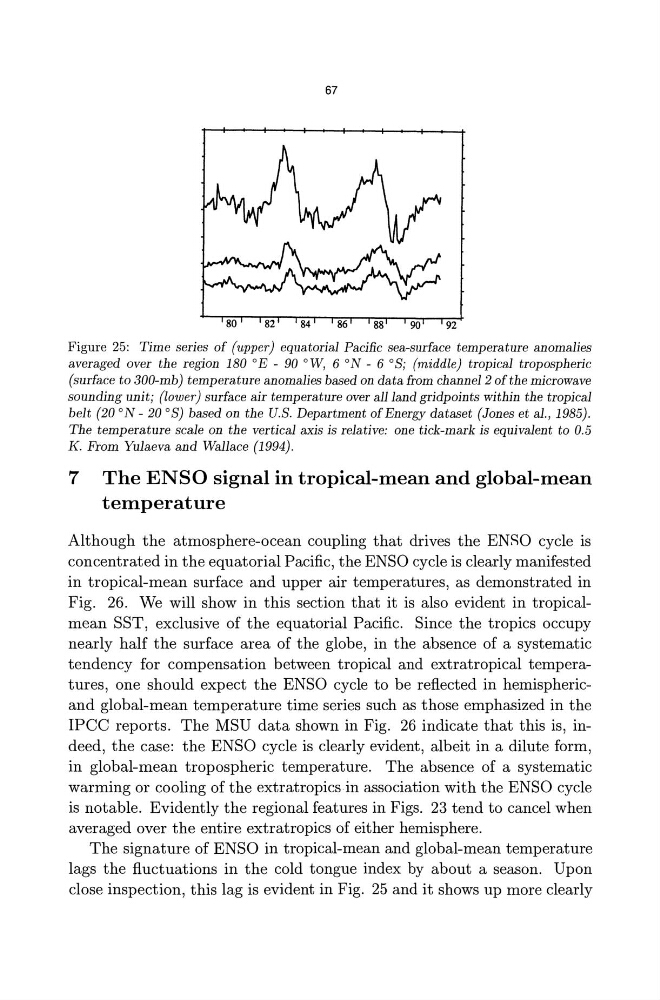
Figure 25: Time series of (upper) equatorial Pacific sea-surface temperature anomalies
averaged over the region 180 °E - 90 oW, 6 oN - 6 oS; (middle) tropical tropospheric
(surface to 300-mb) temperature anomalies based on data from channel 2 of the microwave
sounding unit; (lower) surface air temperature over all land gridpoints within the tropical
belt (20 oN - 20 OS) based on the U.S. Department of Energy dataset (Jones et aI., 1985).
The temperature scale on the vertical axis is relative: one tick-mark is equivalent to 0.5
K. From Yulaeva and Wallace (1994).
7 The ENSO signal in tropical-mean and global-mean
temperature
Although the atmosphere-ocean coupling that drives the ENRO cycle is
concentrated in the equatorial Pacific, the ENSO cycle is clearly manifested
in tropical-mean surface and upper air temperatures, as demonstrated in
Fig. 26. We will show in this section that it is also evident in tropicalmean SST, exclusive of the equatorial Pacific. Since the tropics occupy
nearly half the surface area of the globe, in the absence of a systematic
tendency for compensation between tropical and extratropical temperatures, one should expect the ENSO cycle to be reflected in hemisphericand global-mean temperature time series such as those emphasized in the
IPCC reports. The MSU data shown in Fig. 26 indicate that this is, indeed, the case: the ENSO cycle is clearly evident, albeit in a dilute form,
in global-mean tropospheric temperature. The absence of a systematic
warming or cooling of the extratropics·in association with the ENSO cycle
is notable. Evidently the regional features in Figs. 23 tend to cancel when
averaged over the entire extratropics of either hemisphere.
The signature of ENSO in tropical-mean and global-mean temperature
lags the fluctuations in the cold tongue index by about a season. Upon
close inspection, this lag is evident in Fig. 25 and it shows up more clearly
80
82
84
86
88
90
92
Figure 25: Time series of (upper) equatorial Pacific sea-surface temperature anomalies
averaged over the region 180 °E - 90 oW, 6 oN - 6 oS; (middle) tropical tropospheric
(surface to 300-mb) temperature anomalies based on data from channel 2 of the microwave
sounding unit; (lower) surface air temperature over all land gridpoints within the tropical
belt (20 oN - 20 OS) based on the U.S. Department of Energy dataset (Jones et aI., 1985).
The temperature scale on the vertical axis is relative: one tick-mark is equivalent to 0.5
K. From Yulaeva and Wallace (1994).
7 The ENSO signal in tropical-mean and global-mean
temperature
Although the atmosphere-ocean coupling that drives the ENRO cycle is
concentrated in the equatorial Pacific, the ENSO cycle is clearly manifested
in tropical-mean surface and upper air temperatures, as demonstrated in
Fig. 26. We will show in this section that it is also evident in tropicalmean SST, exclusive of the equatorial Pacific. Since the tropics occupy
nearly half the surface area of the globe, in the absence of a systematic
tendency for compensation between tropical and extratropical temperatures, one should expect the ENSO cycle to be reflected in hemisphericand global-mean temperature time series such as those emphasized in the
IPCC reports. The MSU data shown in Fig. 26 indicate that this is, indeed, the case: the ENSO cycle is clearly evident, albeit in a dilute form,
in global-mean tropospheric temperature. The absence of a systematic
warming or cooling of the extratropics·in association with the ENSO cycle
is notable. Evidently the regional features in Figs. 23 tend to cancel when
averaged over the entire extratropics of either hemisphere.
The signature of ENSO in tropical-mean and global-mean temperature
lags the fluctuations in the cold tongue index by about a season. Upon
close inspection, this lag is evident in Fig. 25 and it shows up more clearly