

66
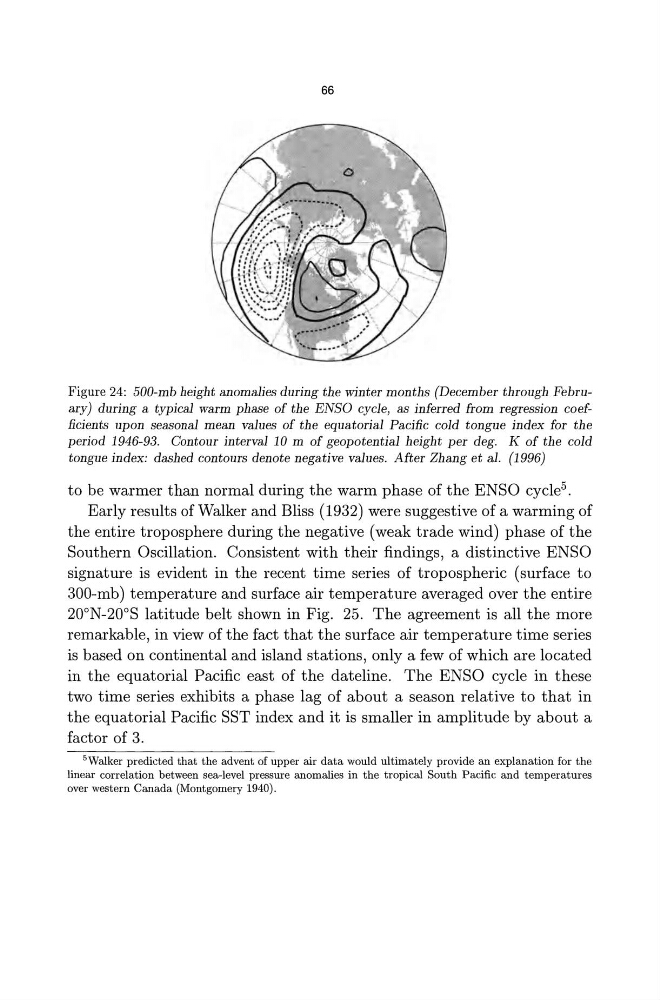
Figure 24: 500-mb height anomalies during the winter months (December through February) during a typical warm phase of the ENSO cycle, as inferred from regression coefficients upon seasonal mean values of the equatorial P acific cold tongue index for the
period 1946-93. Contour interval 10 m of geopotential height per deg. K of the cold
tongue index: dashed contours denote negative values. After Zhang et al. (1996)
to be warmer than normal during the warm phase of the ENSO cycle 5 .
Early results of Walker and Bliss (1932) were suggestive of a warming of
the entire troposphere during the negative (weak trade wind) phase of the
Southern Oscillation. Consistent with their findings, a distinctive ENSO
signature is evident in the recent time series of tropospheric (surface to
300-mb) temperature and surface air temperature averaged over the entire
20oN-20oS latitude belt shown in Fig. 25. The agreement is all the more
remarkable, in view of the fact that the surface air temperature time series
is based on continental and island stations, only a few of which are located
in the equatorial Pacific east of the dateline. The ENSO cycle in these
two time series exhibits a phase lag of about a season relative to that in
the equatorial Pacific SST index and it is smaller in amplitude by about a
factor of 3.
5Walker predicted that the advent of upper air data would ultimately provide an explanation for the
linear correlation between sea-level pressure anomalies in the tropical Sout h Pacific and temperatures
over western Canada (Montgomery 1940).
Figure 24: 500-mb height anomalies during the winter months (December through February) during a typical warm phase of the ENSO cycle, as inferred from regression coefficients upon seasonal mean values of the equatorial P acific cold tongue index for the
period 1946-93. Contour interval 10 m of geopotential height per deg. K of the cold
tongue index: dashed contours denote negative values. After Zhang et al. (1996)
to be warmer than normal during the warm phase of the ENSO cycle 5 .
Early results of Walker and Bliss (1932) were suggestive of a warming of
the entire troposphere during the negative (weak trade wind) phase of the
Southern Oscillation. Consistent with their findings, a distinctive ENSO
signature is evident in the recent time series of tropospheric (surface to
300-mb) temperature and surface air temperature averaged over the entire
20oN-20oS latitude belt shown in Fig. 25. The agreement is all the more
remarkable, in view of the fact that the surface air temperature time series
is based on continental and island stations, only a few of which are located
in the equatorial Pacific east of the dateline. The ENSO cycle in these
two time series exhibits a phase lag of about a season relative to that in
the equatorial Pacific SST index and it is smaller in amplitude by about a
factor of 3.
5Walker predicted that the advent of upper air data would ultimately provide an explanation for the
linear correlation between sea-level pressure anomalies in the tropical Sout h Pacific and temperatures
over western Canada (Montgomery 1940).