

60
------7 10 m s-1
------7 3 m s-1
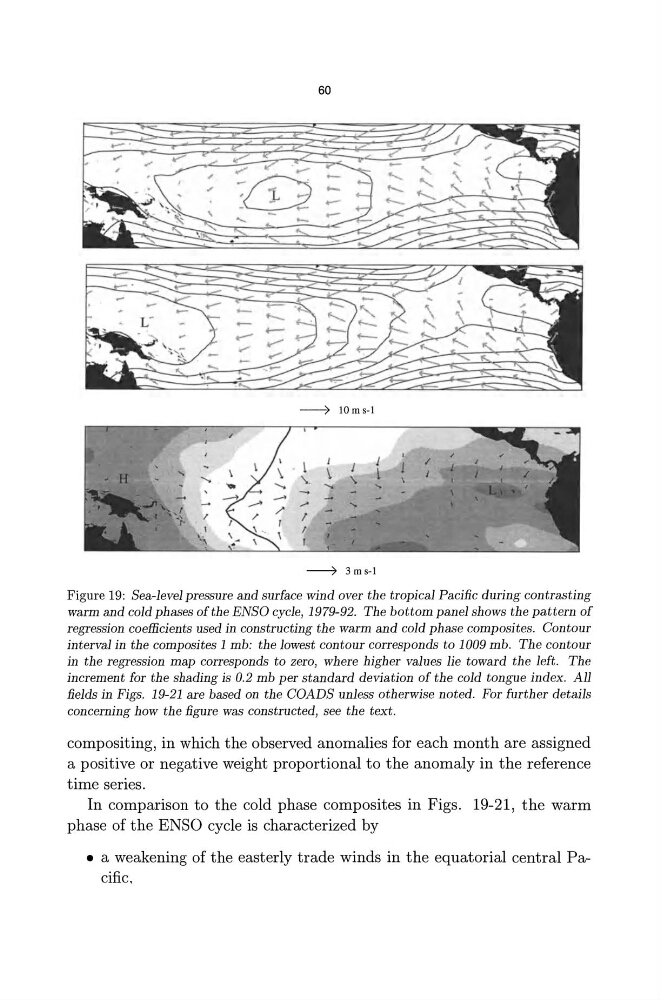
Figure 19: Sea-level pressure and surface wind over the tropical Pacific during contrasting
warm and cold phases of the ENSO cycle, 1979-92. The bottom panel shows the pattern of
regression coefficients used in constructing the warm and cold phase composites. Contour
interval in the composites 1 mb: the lowest contour corresponds to 1009 mb. The contour
in the regression map corresponds to zero, where higher values lie toward the left. The
increment for the shading is 0.2 mb per standard deviation of the cold tongue index. All
fields in Figs. 19-21 are based on the COADS unless otherwise noted. For further details
concerning how the figure was constructed, see the text.
compositing, in which the observed anomalies for each month are assigned
a positive or negative weight proportional to the anomaly in the reference
time series.
In comparison to the cold phase composites in Figs. 19-21, the warm
phase of the ENSO cycle is characterized by
• a weakening of the easterly trade winds in the equatorial central Pacific,
------7 10 m s-1
------7 3 m s-1
Figure 19: Sea-level pressure and surface wind over the tropical Pacific during contrasting
warm and cold phases of the ENSO cycle, 1979-92. The bottom panel shows the pattern of
regression coefficients used in constructing the warm and cold phase composites. Contour
interval in the composites 1 mb: the lowest contour corresponds to 1009 mb. The contour
in the regression map corresponds to zero, where higher values lie toward the left. The
increment for the shading is 0.2 mb per standard deviation of the cold tongue index. All
fields in Figs. 19-21 are based on the COADS unless otherwise noted. For further details
concerning how the figure was constructed, see the text.
compositing, in which the observed anomalies for each month are assigned
a positive or negative weight proportional to the anomaly in the reference
time series.
In comparison to the cold phase composites in Figs. 19-21, the warm
phase of the ENSO cycle is characterized by
• a weakening of the easterly trade winds in the equatorial central Pacific,