

~
:;)
N
Q)
c.
E
Q)
I1910
1930
57
. .
1950
1970
[990
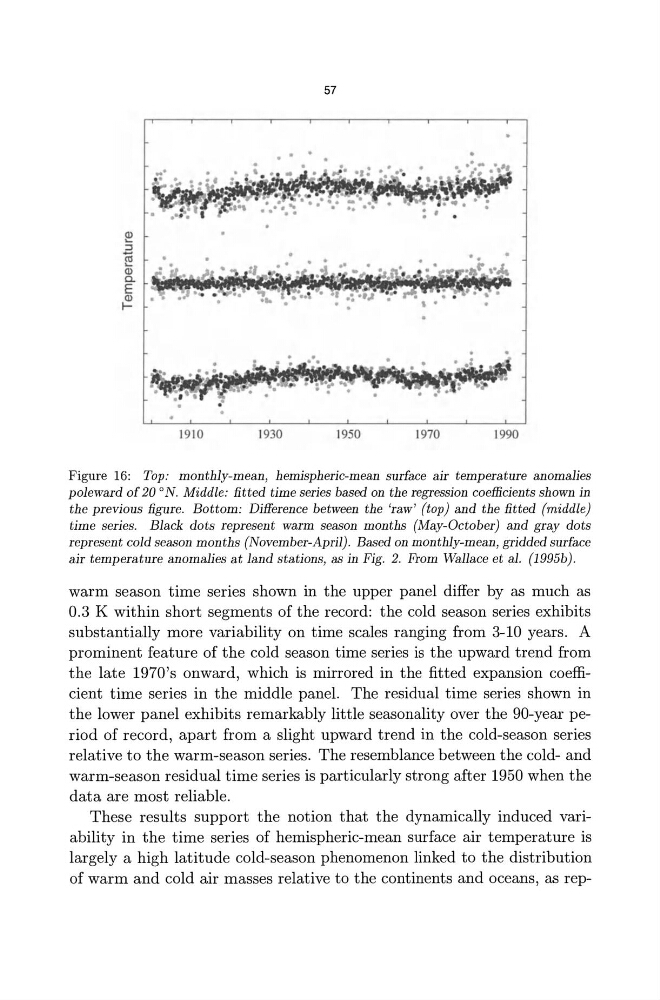
Figure 16: Top: monthly-mean, hemispheric-mean surface air temperature anomalies
poleward of 20 0 N. Middle: fitted time series based on the regression coefficients shown in
the previous figure. Bottom: Difference between the 'raw' (top) and the fitted (middle)
time series. Black dots represent warm season months (May-October) and gray dots
represent cold season months (November-April) . Based on monthly-mean, gridded surface
air temperature anomalies at land stations, as in Fig. 2. From Wallace et al. (1995b).
warm season time series shown in the upper panel differ by as much as
0.3 K within short segments of the record: the cold season series exhibits
substantially more variability on time scales ranging from 3-10 years. A
prominent feature of the cold season time series is the upward trend from
the late 1970's onward, which is mirrored in the fitted expansion coefficient time series in the middle panel. The residual time series shown in
the lower panel exhibits remarkably little seasonality over the 90-year period of record, apart from a slight upward trend in the cold-season series
relative to the warm-season series. The resemblance between the cold- and
warm-season residual time series is particularly strong after 1950 when the
data are most reliable.
These results support the notion that the dynamically induced variability in the time series of hemispheric-mean surface air temperature is
largely a high latitude cold-season phenomenon linked to the distribution
of warm and cold air masses relative to the continents and oceans, as rep-
:;)
N
Q)
c.
E
Q)
I1910
1930
57
. .
1950
1970
[990
Figure 16: Top: monthly-mean, hemispheric-mean surface air temperature anomalies
poleward of 20 0 N. Middle: fitted time series based on the regression coefficients shown in
the previous figure. Bottom: Difference between the 'raw' (top) and the fitted (middle)
time series. Black dots represent warm season months (May-October) and gray dots
represent cold season months (November-April) . Based on monthly-mean, gridded surface
air temperature anomalies at land stations, as in Fig. 2. From Wallace et al. (1995b).
warm season time series shown in the upper panel differ by as much as
0.3 K within short segments of the record: the cold season series exhibits
substantially more variability on time scales ranging from 3-10 years. A
prominent feature of the cold season time series is the upward trend from
the late 1970's onward, which is mirrored in the fitted expansion coefficient time series in the middle panel. The residual time series shown in
the lower panel exhibits remarkably little seasonality over the 90-year period of record, apart from a slight upward trend in the cold-season series
relative to the warm-season series. The resemblance between the cold- and
warm-season residual time series is particularly strong after 1950 when the
data are most reliable.
These results support the notion that the dynamically induced variability in the time series of hemispheric-mean surface air temperature is
largely a high latitude cold-season phenomenon linked to the distribution
of warm and cold air masses relative to the continents and oceans, as rep-