

468
0.8
1.00
Q)
"0 0.6
:::J
."!:
0.95
is..
."
E 0.4
I
-
«
m
(JJ
~
0.90 -
t- 0.2
~
0.0
0.85
0.0
0.1
0.2
0.3
0.4
0.5
Frequency (cycles/month)
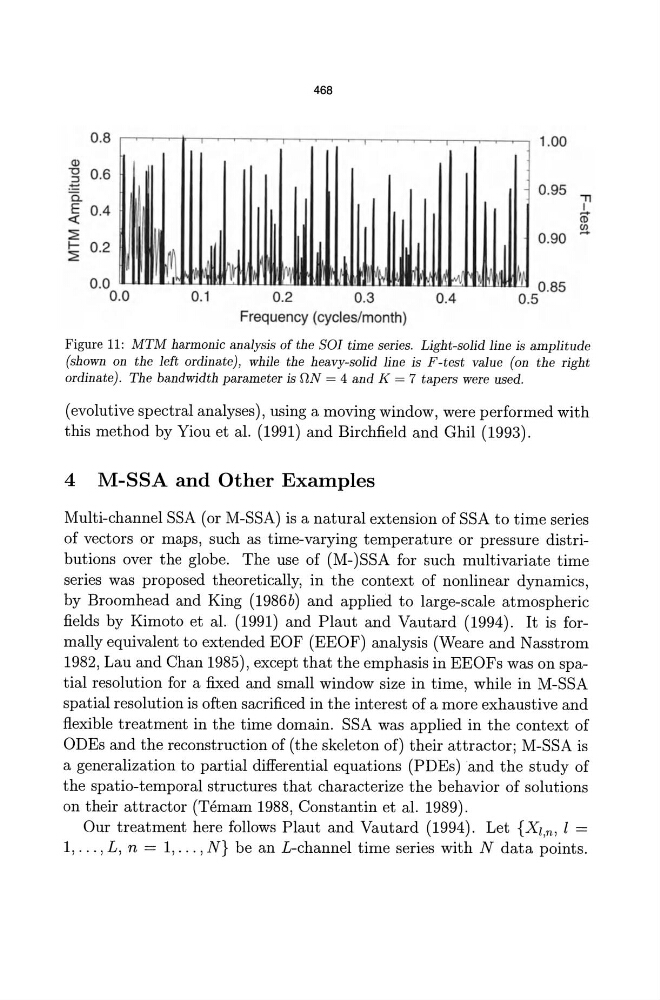
Figure 11: MTM harmonic analysis of the Sal time series. Light-solid line is amplitude
(shown on the left ordinate), while the heavy-solid line is F -test value (on the right
ordinate) . The bandwidth parameter is ON = 4 and K = 7 tapers were used.
(evolutive spectral analyses), using a moving window, were performed with
this method by Yiou et al. (1991) and Birchfield and Ghil (1993).
4 M-SSA and Other Examples
Multi-channel SSA (or M-SSA) is a natural extension of SSA to time series
of vectors or maps, such as time-varying temperature or pressure distributions over the globe. The use of (M-)SSA for such multivariate time
series was proposed theoretically, in the context of nonlinear dynamics,
by Broomhead and King (1986b) and applied to large-scale atmospheric
fields by Kimoto et al. (1991) and Plaut and Vautard (1994). It is formally equivalent to extended EOF (EEOF) analysis (Weare and Nasstrom
1982, Lau and Chan 1985), except that the emphasis in EEOFs was on spatial resolution for a fixed and small window size in time, while in M-SSA
spatial resolution is often sacrificed in the interest of a more exhaustive and
flexible treatment in the time domain. SSA was applied in the context of
ODEs and the reconstruction of (the skeleton of) their attractor; M-SSA is
a generalization to partial differential equations (PDEs) and the study of
the spatio-temporal structures that characterize the behavior of solutions
on their attractor (Temam 1988, Constantin et al. 1989).
Our treatment here follows Plaut and Vautard (1994). Let {XZ,n, l =
1, ... , L, n = 1, ... , N} be an L-channel time series with N data points.
0.8
1.00
Q)
"0 0.6
:::J
."!:
0.95
is..
."
E 0.4
I
-
«
m
(JJ
~
0.90 -
t- 0.2
~
0.0
0.85
0.0
0.1
0.2
0.3
0.4
0.5
Frequency (cycles/month)
Figure 11: MTM harmonic analysis of the Sal time series. Light-solid line is amplitude
(shown on the left ordinate), while the heavy-solid line is F -test value (on the right
ordinate) . The bandwidth parameter is ON = 4 and K = 7 tapers were used.
(evolutive spectral analyses), using a moving window, were performed with
this method by Yiou et al. (1991) and Birchfield and Ghil (1993).
4 M-SSA and Other Examples
Multi-channel SSA (or M-SSA) is a natural extension of SSA to time series
of vectors or maps, such as time-varying temperature or pressure distributions over the globe. The use of (M-)SSA for such multivariate time
series was proposed theoretically, in the context of nonlinear dynamics,
by Broomhead and King (1986b) and applied to large-scale atmospheric
fields by Kimoto et al. (1991) and Plaut and Vautard (1994). It is formally equivalent to extended EOF (EEOF) analysis (Weare and Nasstrom
1982, Lau and Chan 1985), except that the emphasis in EEOFs was on spatial resolution for a fixed and small window size in time, while in M-SSA
spatial resolution is often sacrificed in the interest of a more exhaustive and
flexible treatment in the time domain. SSA was applied in the context of
ODEs and the reconstruction of (the skeleton of) their attractor; M-SSA is
a generalization to partial differential equations (PDEs) and the study of
the spatio-temporal structures that characterize the behavior of solutions
on their attractor (Temam 1988, Constantin et al. 1989).
Our treatment here follows Plaut and Vautard (1994). Let {XZ,n, l =
1, ... , L, n = 1, ... , N} be an L-channel time series with N data points.