

467
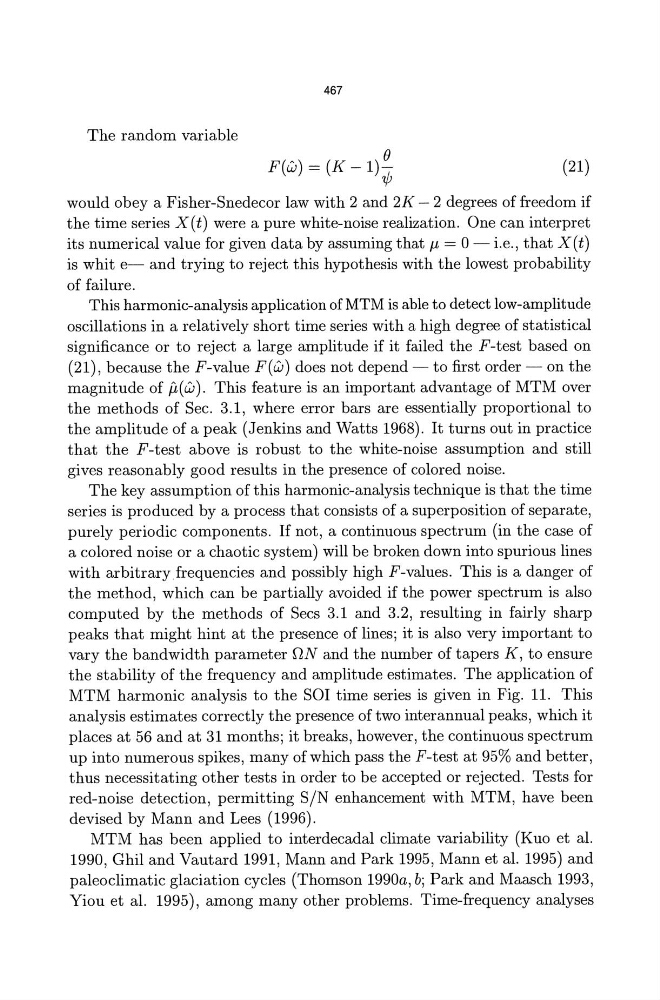
The random variable
F(w) = (K - 1)~
(21)
would obey a Fisher-Snedecor law with 2 and 2K - 2 degrees of freedom if
the time series X(t) were a pure white-noise realization. One can interpret
its numerical value for given data by assuming that J.L = 0- i.e., that X(t)
is whit e- and trying to reject this hypothesis with the lowest probability
of failure.
This harmonic-analysis application of MTM is able to detect low-amplitude
oscillations in a relatively short time series with a high degree of statistical
significance or to reject a large amplitude if it failed the F-test based on
(21), because the F-value F(w) does not depend - to first order - on the
magnitude of jl( w). This feature is an important advantage of MTM over
the methods of Sec. 3.1, where error bars are essentially proportional to
the amplitude of a peak (Jenkins and Watts 1968). It turns out in practice
that the F-test above is robust to the white-noise assumption and still
gives reasonably good results in the presence of colored noise.
The key assumption of this harmonic-analysis technique is that the time
series is produced by a process that consists of a superposition of separate,
purely periodic components. If not, a continuous spectrum (in the case of
a colored noise or a chaotic system) will be broken down into spurious lines
with arbitrary frequencies and possibly high F-values. This is a danger of
the method, which can be partially avoided if the power spectrum is also
computed by the methods of Secs 3.1 and 3.2, resulting in fairly sharp
peaks that might hint at the presence of lines; it is also very important to
vary the bandwidth parameter ON and the number of tapers K, to ensure
the stability of the frequency and amplitude estimates. The application of
MTM harmonic analysis to the SOl time series is given in Fig. 11. This
analysis estimates correctly the presence of two interannual peaks, which it
places at 56 and at 31 months; it breaks, however, the continuous spectrum
up into numerous spikes, many of which pass the F-test at 95% and better,
thus necessitating other tests in order to be accepted or rejected. Tests for
red-noise detection, permitting SIN enhancement with MTM, have been
devised by Mann and Lees (1996).
MTM has been applied to interdecadal climate variability (Kuo et al.
1990, Ghil and Vautard 1991, Mann and Park 1995, Mann et al. 1995) and
paleoclimatic glaciation cycles (Thomson 1990a, b; Park and Maasch 1993,
Yiou et al. 1995), among many other problems. Time-frequency analyses
The random variable
F(w) = (K - 1)~
(21)
would obey a Fisher-Snedecor law with 2 and 2K - 2 degrees of freedom if
the time series X(t) were a pure white-noise realization. One can interpret
its numerical value for given data by assuming that J.L = 0- i.e., that X(t)
is whit e- and trying to reject this hypothesis with the lowest probability
of failure.
This harmonic-analysis application of MTM is able to detect low-amplitude
oscillations in a relatively short time series with a high degree of statistical
significance or to reject a large amplitude if it failed the F-test based on
(21), because the F-value F(w) does not depend - to first order - on the
magnitude of jl( w). This feature is an important advantage of MTM over
the methods of Sec. 3.1, where error bars are essentially proportional to
the amplitude of a peak (Jenkins and Watts 1968). It turns out in practice
that the F-test above is robust to the white-noise assumption and still
gives reasonably good results in the presence of colored noise.
The key assumption of this harmonic-analysis technique is that the time
series is produced by a process that consists of a superposition of separate,
purely periodic components. If not, a continuous spectrum (in the case of
a colored noise or a chaotic system) will be broken down into spurious lines
with arbitrary frequencies and possibly high F-values. This is a danger of
the method, which can be partially avoided if the power spectrum is also
computed by the methods of Secs 3.1 and 3.2, resulting in fairly sharp
peaks that might hint at the presence of lines; it is also very important to
vary the bandwidth parameter ON and the number of tapers K, to ensure
the stability of the frequency and amplitude estimates. The application of
MTM harmonic analysis to the SOl time series is given in Fig. 11. This
analysis estimates correctly the presence of two interannual peaks, which it
places at 56 and at 31 months; it breaks, however, the continuous spectrum
up into numerous spikes, many of which pass the F-test at 95% and better,
thus necessitating other tests in order to be accepted or rejected. Tests for
red-noise detection, permitting SIN enhancement with MTM, have been
devised by Mann and Lees (1996).
MTM has been applied to interdecadal climate variability (Kuo et al.
1990, Ghil and Vautard 1991, Mann and Park 1995, Mann et al. 1995) and
paleoclimatic glaciation cycles (Thomson 1990a, b; Park and Maasch 1993,
Yiou et al. 1995), among many other problems. Time-frequency analyses