

466
transform of a clean periodic signal of infinite length yields a Dirac function
at the frequency of the signal, viz., a line (or peak of zero width) with
infinite magnitude. A spectral estimate based on the methods of Secs. 3.1
or 3.2 gives indirect information on the amplitude of the signal at a given
frequency, through the area under the peak centered at that frequency and
whose width is, roughly speaking, inversely proportional to the length N of
the time series; this area is nearly constant, since the height of the peak is
also proportional to N. Harmonic analysis attempts, instead, to determine
directly the (finite) amplitude of a (pure) line in the spectrum of a time
series of finite length. We explain next how this is done within MTM. Other
approaches to this problem, closer in spirit to the periodogram mentioned
in Sec. 3.1, are described by MacDonald (1989).
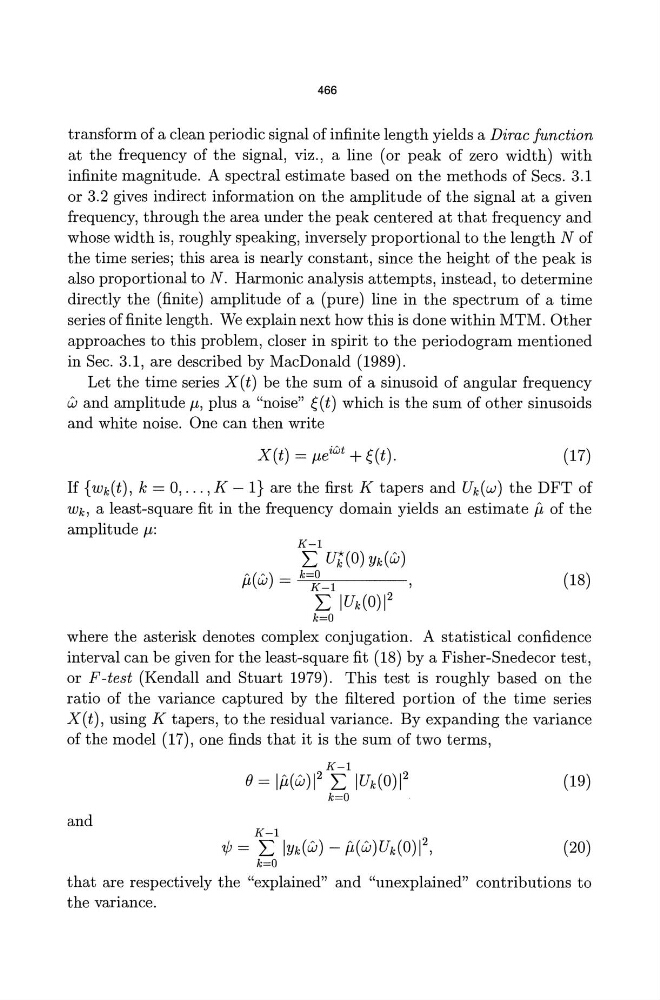
Let the time series X(t) be the sum of a sinusoid of angular frequency
wand amplitude f..l, plus a "noise" e(t) which is the sum of other sinusoids
and white noise. One can then write
X(t) = f..leiwt + e(t).
(17)
If {Wk(t), k = 0, ... , K -I} are the first K tapers and Uk(W) the DFT of
Wk, a least-square fit in the frequency domain yields an estimate p, of the
amplitude f..l:
K-l
L ut(O) Yk(W)
p,(w) = k=~_l
(18)
L IUk(0)1 2
k=O
where the asterisk denotes complex conjugation. A statistical confidence
interval can be given for the least-square fit (18) by a Fisher-Snedecor test,
or F-test (Kendall and Stuart 1979). This test is roughly based on the
ratio of the variance captured by the filtered portion of the time series
X(t), using K tapers, to the residual variance. By expanding the variance
ofthe model (17), one finds that it is the sum of two terms,
K-l
() = lp,(wW L IUk (0)1 2
(19)
k=O
and
(20)
that are respectively the "explained" and "unexplained" contributions to
the variance.
transform of a clean periodic signal of infinite length yields a Dirac function
at the frequency of the signal, viz., a line (or peak of zero width) with
infinite magnitude. A spectral estimate based on the methods of Secs. 3.1
or 3.2 gives indirect information on the amplitude of the signal at a given
frequency, through the area under the peak centered at that frequency and
whose width is, roughly speaking, inversely proportional to the length N of
the time series; this area is nearly constant, since the height of the peak is
also proportional to N. Harmonic analysis attempts, instead, to determine
directly the (finite) amplitude of a (pure) line in the spectrum of a time
series of finite length. We explain next how this is done within MTM. Other
approaches to this problem, closer in spirit to the periodogram mentioned
in Sec. 3.1, are described by MacDonald (1989).
Let the time series X(t) be the sum of a sinusoid of angular frequency
wand amplitude f..l, plus a "noise" e(t) which is the sum of other sinusoids
and white noise. One can then write
X(t) = f..leiwt + e(t).
(17)
If {Wk(t), k = 0, ... , K -I} are the first K tapers and Uk(W) the DFT of
Wk, a least-square fit in the frequency domain yields an estimate p, of the
amplitude f..l:
K-l
L ut(O) Yk(W)
p,(w) = k=~_l
(18)
L IUk(0)1 2
k=O
where the asterisk denotes complex conjugation. A statistical confidence
interval can be given for the least-square fit (18) by a Fisher-Snedecor test,
or F-test (Kendall and Stuart 1979). This test is roughly based on the
ratio of the variance captured by the filtered portion of the time series
X(t), using K tapers, to the residual variance. By expanding the variance
ofthe model (17), one finds that it is the sum of two terms,
K-l
() = lp,(wW L IUk (0)1 2
(19)
k=O
and
(20)
that are respectively the "explained" and "unexplained" contributions to
the variance.