

C\I
I
()
c...
"<:t
I
(t)
()
c...
20
10
o
-10
-20
10
o
-10
-20
455
o
200
400
600
Time (months)
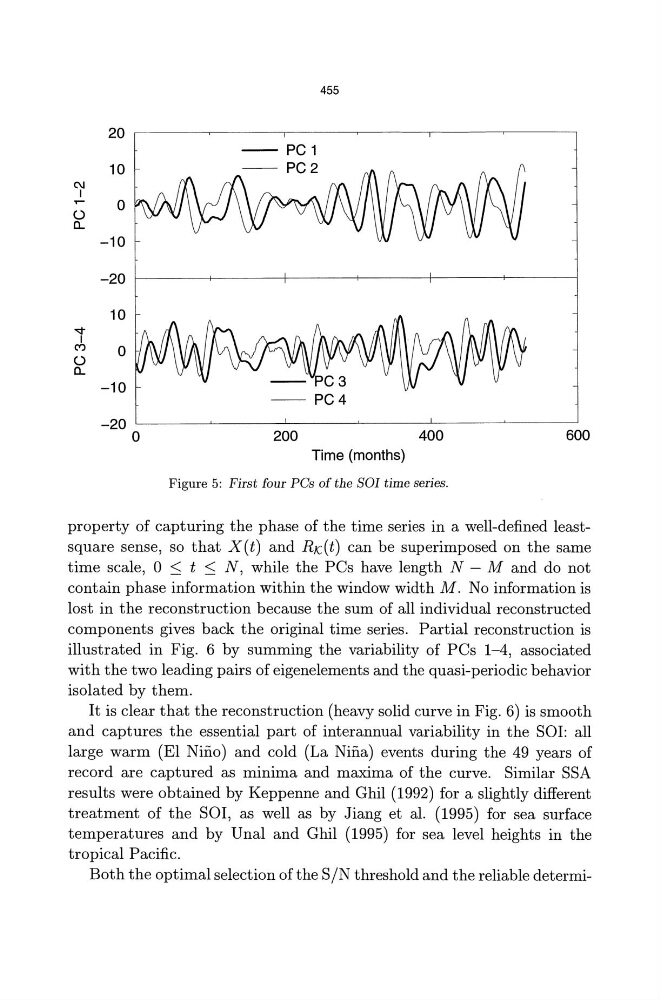
Figure 5: First four PCs of the SOl time series.
property of capturing the phase of the time series in a well-defined leastsquare sense, so that X(t) and RJC(t) can be superimposed on the same
time scale, 0 :s; t :s; N, while the PCs have length N - M and do not
contain phase information within the window width M. No information is
lost in the reconstruction because the sum of all individual reconstructed
components gives back the original time series. Partial reconstruction is
illustrated in Fig. 6 by summing the variability of PCs 1-4, associated
with the two leading pairs of eigenelements and the quasi-periodic behavior
isolated by them.
It is clear that the reconstruction (heavy solid curve in Fig. 6) is smooth
and captures the essential part of interannual variability in the SOl: all
large warm (El Nino) and cold (La Nina) events during the 49 years of
record are captured as minima and maxima of the curve. Similar SSA
results were obtained by Keppenne and Ghil (1992) for a slightly different
treatment of the SOl, as well as by Jiang et al. (1995) for sea surface
temperatures and by Unal and Ghil (1995) for sea level heights in the
tropical Pacific.
Both the optimal selection of the S IN threshold and the reliable determi-
I
()
c...
"<:t
I
(t)
()
c...
20
10
o
-10
-20
10
o
-10
-20
455
o
200
400
600
Time (months)
Figure 5: First four PCs of the SOl time series.
property of capturing the phase of the time series in a well-defined leastsquare sense, so that X(t) and RJC(t) can be superimposed on the same
time scale, 0 :s; t :s; N, while the PCs have length N - M and do not
contain phase information within the window width M. No information is
lost in the reconstruction because the sum of all individual reconstructed
components gives back the original time series. Partial reconstruction is
illustrated in Fig. 6 by summing the variability of PCs 1-4, associated
with the two leading pairs of eigenelements and the quasi-periodic behavior
isolated by them.
It is clear that the reconstruction (heavy solid curve in Fig. 6) is smooth
and captures the essential part of interannual variability in the SOl: all
large warm (El Nino) and cold (La Nina) events during the 49 years of
record are captured as minima and maxima of the curve. Similar SSA
results were obtained by Keppenne and Ghil (1992) for a slightly different
treatment of the SOl, as well as by Jiang et al. (1995) for sea surface
temperatures and by Unal and Ghil (1995) for sea level heights in the
tropical Pacific.
Both the optimal selection of the S IN threshold and the reliable determi-