

6
4
2
(5 0
C/)
-2
-4
456
-6 L-~ _ _ ~ _ _ ~ _ _ L-~ _ _ - L _ _ ~ _ _ ~ _ _ ~~ _ _ ~~
o
100
200
300
Time (months)
400
500
600
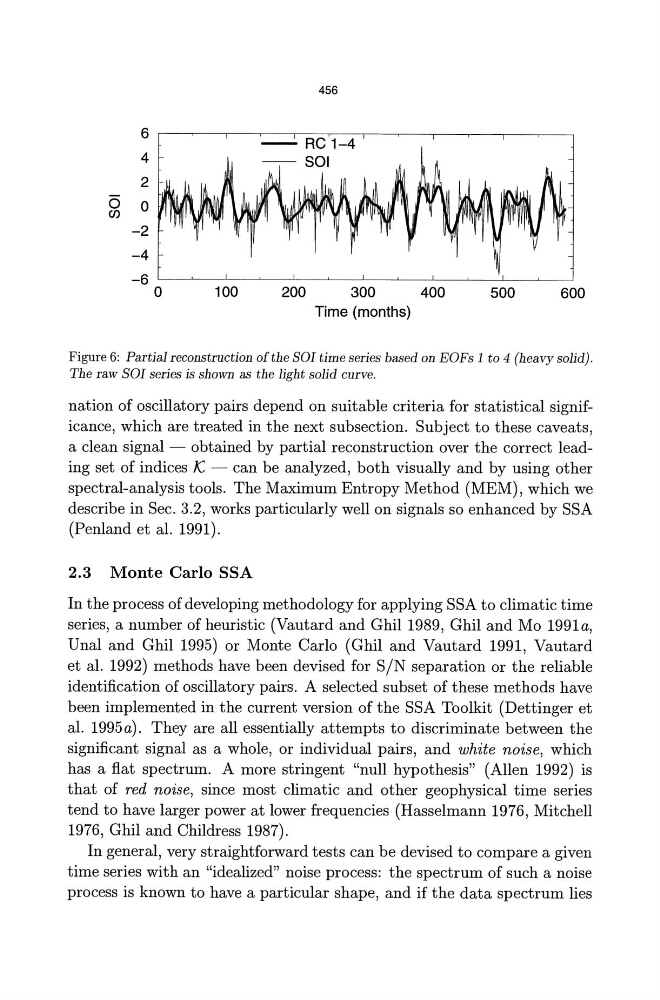
Figure 6: Partial reconstruction of the SOl time series based on EOFs 1 to 4 (heavy solid).
The raw SOl series is shown as the light solid curve.
nation of oscillatory pairs depend on suitable criteria for statistical significance, which are treated in the next subsection. Subject to these caveats,
a clean signal - obtained by partial reconstruction over the correct leading set of indices K - can be analyzed, both visually and by using other
spectral-analysis tools. The Maximum Entropy Method (MEM), which we
describe in Sec. 3.2, works particularly well on signals so enhanced by SSA
(Penland et al. 1991).
2.3 Monte Carlo SSA
In the process of developing methodology for applying SSA to climatic time
series, a number of heuristic (Vautard and Ghil 1989, Ghil and Mo 1991a,
Unal and Ghil 1995) or Monte Carlo (Ghil and Vautard 1991, Vautard
et al. 1992) methods have been devised for SIN separation or the reliable
identification of oscillatory pairs. A selected subset of these methods have
been implemented in the current version of the SSA Toolkit (Dettinger et
al. 1995a). They are all essentially attempts to discriminate between the
significant signal as a whole, or individual pairs, and white noise, which
has a flat spectrum. A more stringent "null hypothesis" (Allen 1992) is
that of red noise, since most climatic and other geophysical time series
tend to have larger power at lower frequencies (Hasselmann 1976, Mitchell
1976, Ghil and Childress 1987).
In general, very straightforward tests can be devised to compare a given
time series with an "idealized" noise process: the spectrum of such a noise
process is known to have a particular shape, and if the data spectrum lies
4
2
(5 0
C/)
-2
-4
456
-6 L-~ _ _ ~ _ _ ~ _ _ L-~ _ _ - L _ _ ~ _ _ ~ _ _ ~~ _ _ ~~
o
100
200
300
Time (months)
400
500
600
Figure 6: Partial reconstruction of the SOl time series based on EOFs 1 to 4 (heavy solid).
The raw SOl series is shown as the light solid curve.
nation of oscillatory pairs depend on suitable criteria for statistical significance, which are treated in the next subsection. Subject to these caveats,
a clean signal - obtained by partial reconstruction over the correct leading set of indices K - can be analyzed, both visually and by using other
spectral-analysis tools. The Maximum Entropy Method (MEM), which we
describe in Sec. 3.2, works particularly well on signals so enhanced by SSA
(Penland et al. 1991).
2.3 Monte Carlo SSA
In the process of developing methodology for applying SSA to climatic time
series, a number of heuristic (Vautard and Ghil 1989, Ghil and Mo 1991a,
Unal and Ghil 1995) or Monte Carlo (Ghil and Vautard 1991, Vautard
et al. 1992) methods have been devised for SIN separation or the reliable
identification of oscillatory pairs. A selected subset of these methods have
been implemented in the current version of the SSA Toolkit (Dettinger et
al. 1995a). They are all essentially attempts to discriminate between the
significant signal as a whole, or individual pairs, and white noise, which
has a flat spectrum. A more stringent "null hypothesis" (Allen 1992) is
that of red noise, since most climatic and other geophysical time series
tend to have larger power at lower frequencies (Hasselmann 1976, Mitchell
1976, Ghil and Childress 1987).
In general, very straightforward tests can be devised to compare a given
time series with an "idealized" noise process: the spectrum of such a noise
process is known to have a particular shape, and if the data spectrum lies