

354
20r-------~------~------~------_.
o
-5
" '.
\ '.
.... .... " .... ,----------10~------~--------~------~--------~
o
500
1000
Years
1500
2000
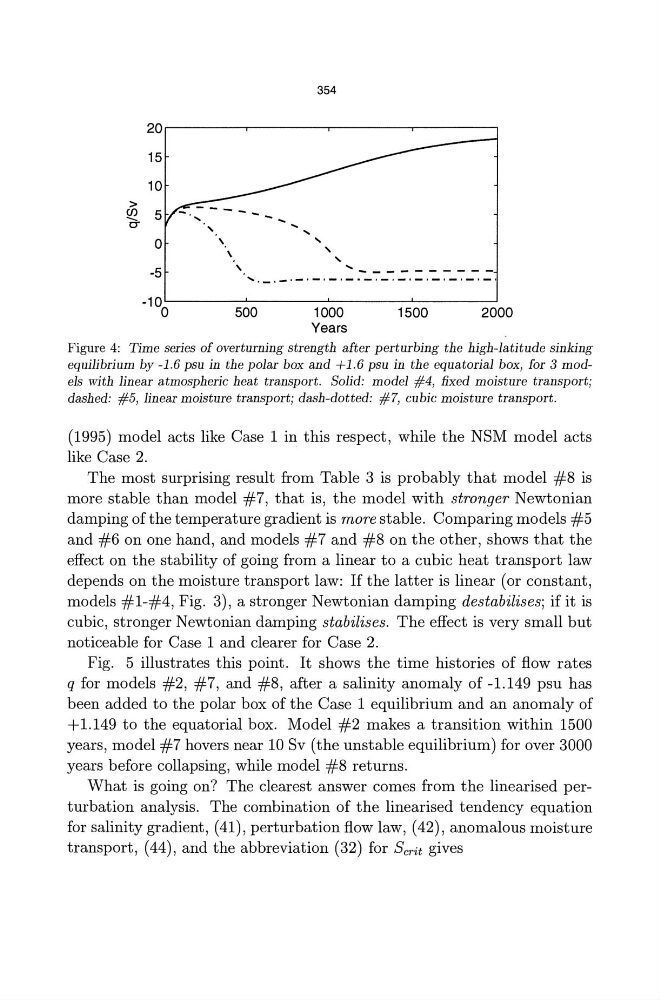
Figure 4: Time series of overturning strength after perturbing the high-latitude sinking
equilibrium by -1.6 psu in the polar box and +1.6 psu in the equatorial box, for 3 models with linear atmospheric heat transport. Solid: model #4, fixed moisture transport;
dashed: #5, linear moisture transport; dash-dotted: #7, cubic moisture transport.
(1995) model acts like Case 1 in this respect, while the NSM model acts
like Case 2.
The most surprising result from Table 3 is probably that model #8 is
more stable than model #7, that is, the model with stronger Newtonian
damping of the temperature gradient is more stable. Comparing models #5
and #6 on one hand, and models #7 and #8 on the other, shows that the
effect on the stability of going from a linear to a cubic heat transport law
depends on the moisture transport law: If the latter is linear (or constant,
models #1-#4, Fig. 3), a stronger Newtonian damping destabilises; if it is
cubic, stronger Newtonian damping stabilises. The effect is very small but
noticeable for Case 1 and clearer for Case 2.
Fig. 5 illustrates this point. It shows the time histories of flow rates
q for models #2, #7, and #8, after a salinity anomaly of -1.149 psu has
been added to the polar box of the Case 1 equilibrium and an anomaly of
+1.149 to the equatorial box. Model #2 makes a transition within 1500
years, model #7 hovers near 10 Sv (the unstable equilibrium) for over 3000
years before collapsing, while model #8 returns.
What is going on? The clearest answer comes from the linearised perturbation analysis. The combination of the linearised tendency equation
for salinity gradient, (41), perturbation flow law, (42), anomalous moisture
transport, (44), and the abbreviation (32) for Scrit gives
20r-------~------~------~------_.
o
-5
" '.
\ '.
.... .... " .... ,----------10~------~--------~------~--------~
o
500
1000
Years
1500
2000
Figure 4: Time series of overturning strength after perturbing the high-latitude sinking
equilibrium by -1.6 psu in the polar box and +1.6 psu in the equatorial box, for 3 models with linear atmospheric heat transport. Solid: model #4, fixed moisture transport;
dashed: #5, linear moisture transport; dash-dotted: #7, cubic moisture transport.
(1995) model acts like Case 1 in this respect, while the NSM model acts
like Case 2.
The most surprising result from Table 3 is probably that model #8 is
more stable than model #7, that is, the model with stronger Newtonian
damping of the temperature gradient is more stable. Comparing models #5
and #6 on one hand, and models #7 and #8 on the other, shows that the
effect on the stability of going from a linear to a cubic heat transport law
depends on the moisture transport law: If the latter is linear (or constant,
models #1-#4, Fig. 3), a stronger Newtonian damping destabilises; if it is
cubic, stronger Newtonian damping stabilises. The effect is very small but
noticeable for Case 1 and clearer for Case 2.
Fig. 5 illustrates this point. It shows the time histories of flow rates
q for models #2, #7, and #8, after a salinity anomaly of -1.149 psu has
been added to the polar box of the Case 1 equilibrium and an anomaly of
+1.149 to the equatorial box. Model #2 makes a transition within 1500
years, model #7 hovers near 10 Sv (the unstable equilibrium) for over 3000
years before collapsing, while model #8 returns.
What is going on? The clearest answer comes from the linearised perturbation analysis. The combination of the linearised tendency equation
for salinity gradient, (41), perturbation flow law, (42), anomalous moisture
transport, (44), and the abbreviation (32) for Scrit gives