

transport In 1000 km 3 per year
above. Chahine; 1992
below = Baumgartner & Reichel; 1975
321
Global water cycle
71
71 Transpiration
Vapour Transport
36
40
Groundwater flow
434
Evaporation 425
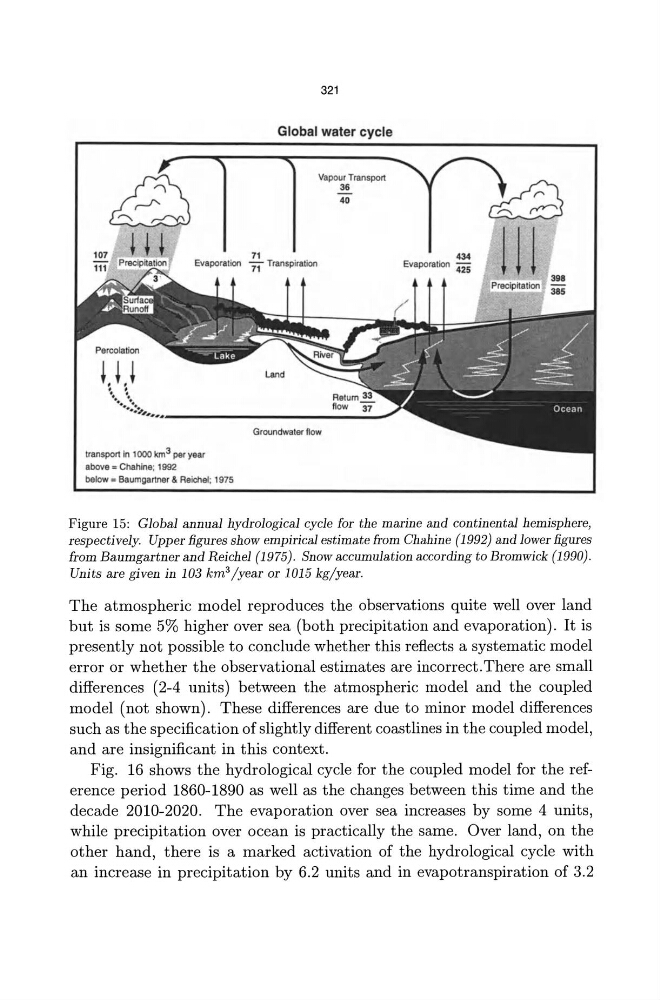
Figure 15: Global annual hydrological cycle for the marine and continental hemisphere,
respectively. Upper figures show empirical estimate from Chahine (1992) and lower figures
from Baumgartner and Reichel (1975). Snow accumulation according to Bromwick (1990) .
Units are given in 103 km 3 /year or 1015 kg/year.
The atmospheric model reproduces the observations quite well over land
but is some 5% higher over sea (both precipitation and evaporation). It is
presently not possible to conclude whether this reflects a systematic model
error or whether the observational estimates are incorrect. There are small
differences (2-4 units) between the atmospheric model and the coupled
model (not shown). These differences are due to minor model differences
such as the specification of slightly different coastlines in the coupled model,
and are insignificant in this context.
Fig. 16 shows the hydrological cycle for the coupled model for the reference period 1860-1890 as well as the changes between this time and the
decade 2010-2020. The evaporation over sea increases by some 4 units,
while precipitation over ocean is practically the same. Over land, on the
other hand, there is a marked activation of the hydrological cycle with
an increase in precipitation by 6.2 units and in evapotranspiration of 3.2
above. Chahine; 1992
below = Baumgartner & Reichel; 1975
321
Global water cycle
71
71 Transpiration
Vapour Transport
36
40
Groundwater flow
434
Evaporation 425
Figure 15: Global annual hydrological cycle for the marine and continental hemisphere,
respectively. Upper figures show empirical estimate from Chahine (1992) and lower figures
from Baumgartner and Reichel (1975). Snow accumulation according to Bromwick (1990) .
Units are given in 103 km 3 /year or 1015 kg/year.
The atmospheric model reproduces the observations quite well over land
but is some 5% higher over sea (both precipitation and evaporation). It is
presently not possible to conclude whether this reflects a systematic model
error or whether the observational estimates are incorrect. There are small
differences (2-4 units) between the atmospheric model and the coupled
model (not shown). These differences are due to minor model differences
such as the specification of slightly different coastlines in the coupled model,
and are insignificant in this context.
Fig. 16 shows the hydrological cycle for the coupled model for the reference period 1860-1890 as well as the changes between this time and the
decade 2010-2020. The evaporation over sea increases by some 4 units,
while precipitation over ocean is practically the same. Over land, on the
other hand, there is a marked activation of the hydrological cycle with
an increase in precipitation by 6.2 units and in evapotranspiration of 3.2