

320
a)
Total Surface Flux
~:~ ~hlIIIIfHt1
1860 1870 1880 1890 1900 1910 1920 1930 1940 1950 1960 1970 1980 1990 2000 2010 2020
year
b)
Integrated Ocean Heat Input
F:IIIIIIIIIIIIII FE
1860 1870 1880 1890 1900 1910 1920 1930 1940 1950 1960 1970 1980 1990 2000 2010 2020
year
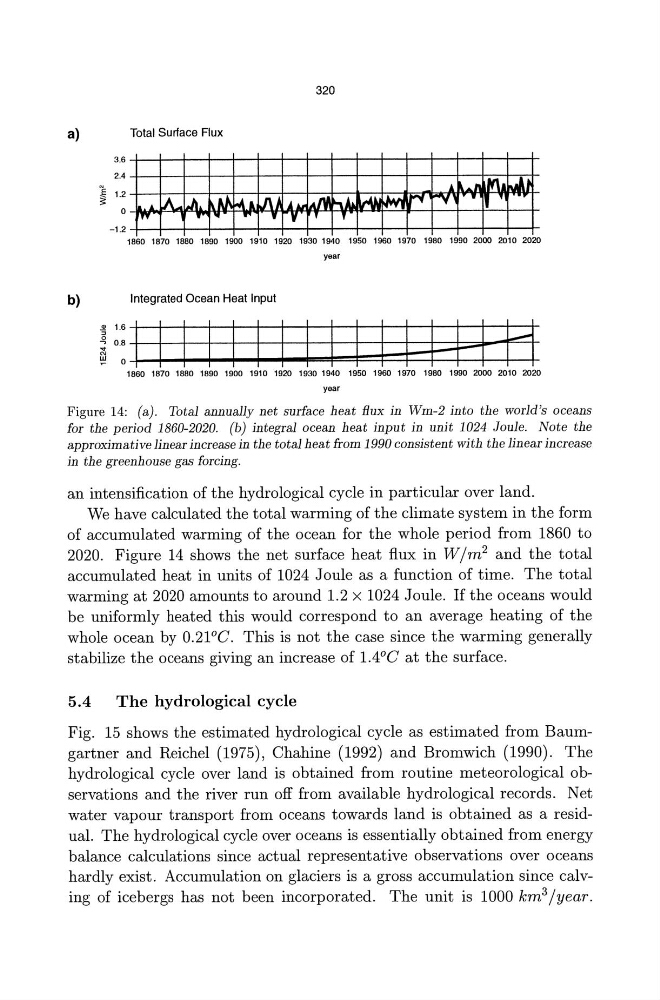
Figure 14: (a). Total annually net surface heat flux in Wm-2 into the world's oceans
for the period 1860-2020. (b) integral ocean heat input in unit 1024 Joule. Note the
approximative linear increase in the total heat from 1990 consistent with the linear increase
in the greenhouse gas forcing.
an intensification of the hydrological cycle in particular over land.
We have calculated the total warming of the climate system in the form
of accumulated warming of the ocean for the whole period from 1860 to
2020. Figure 14 shows the net surface heat flux in Wjm 2 and the total
accumulated heat in units of 1024 Joule as a function of time. The total
warming at 2020 amounts to around 1.2 X 1024 Joule. If the oceans would
be uniformly heated this would correspond to an average heating of the
whole ocean by 0.21°C. This is not the case since the warming generally
stabilize the oceans giving an increase of 1.4°C at the surface.
5.4
The hydrological cycle
Fig. 15 shows the estimated hydrological cycle as estimated from Baumgartner and Reichel (1975), Chahine (1992) and Bromwich (1990). The
hydrological cycle over land is obtained from routine meteorological observations and the river run off from available hydrological records. Net
water vapour transport from oceans towards land is obtained as a residual. The hydrological cycle over oceans is essentially obtained from energy
balance calculations since actual representative observations over oceans
hardly exist. Accumulation on glaciers is a gross accumulation since calving of icebergs has not been incorporated. The unit is 1000 km 3 jyear.
a)
Total Surface Flux
~:~ ~hlIIIIfHt1
1860 1870 1880 1890 1900 1910 1920 1930 1940 1950 1960 1970 1980 1990 2000 2010 2020
year
b)
Integrated Ocean Heat Input
F:IIIIIIIIIIIIII FE
1860 1870 1880 1890 1900 1910 1920 1930 1940 1950 1960 1970 1980 1990 2000 2010 2020
year
Figure 14: (a). Total annually net surface heat flux in Wm-2 into the world's oceans
for the period 1860-2020. (b) integral ocean heat input in unit 1024 Joule. Note the
approximative linear increase in the total heat from 1990 consistent with the linear increase
in the greenhouse gas forcing.
an intensification of the hydrological cycle in particular over land.
We have calculated the total warming of the climate system in the form
of accumulated warming of the ocean for the whole period from 1860 to
2020. Figure 14 shows the net surface heat flux in Wjm 2 and the total
accumulated heat in units of 1024 Joule as a function of time. The total
warming at 2020 amounts to around 1.2 X 1024 Joule. If the oceans would
be uniformly heated this would correspond to an average heating of the
whole ocean by 0.21°C. This is not the case since the warming generally
stabilize the oceans giving an increase of 1.4°C at the surface.
5.4
The hydrological cycle
Fig. 15 shows the estimated hydrological cycle as estimated from Baumgartner and Reichel (1975), Chahine (1992) and Bromwich (1990). The
hydrological cycle over land is obtained from routine meteorological observations and the river run off from available hydrological records. Net
water vapour transport from oceans towards land is obtained as a residual. The hydrological cycle over oceans is essentially obtained from energy
balance calculations since actual representative observations over oceans
hardly exist. Accumulation on glaciers is a gross accumulation since calving of icebergs has not been incorporated. The unit is 1000 km 3 jyear.