

319
Top of atmosphere (TOA)
Change
Main causes
(W/m2)
SW (clear sky)
+ 0.921
Enhanced absorption by water vapor
LW (clear sky)
+ 0.578
Enhanced water vapor greenhouse
SW cloud forcing
-0.653
Enhanced cloud albedo
LW cloud forcing
+ 0.253
Enhanced high-cloud emissivity
Net TOA radiation
+ 1.099
GHG forcing (tropopause)
3.358
Atmosphere (ATM)
SW (clear sky)
+2.147
Enhanced water vapor absorption
LW (clear sky)
-3.990
Enhanced water vapor emission
SW cloud forcing
-0.072
Competition by water vapor
LW cloud forcing
+ 1.291
Enhanced high-cloud emissivity
Net ATM radiation
-0.624
Balanced by sensible and latent heat
GHG forcing (troposphere)
2.810
Surface (SFC)
Sensible heat flux
+0.466
Sulface layer more stable?
Latent heat flux
-1.080
Warmer SST
SW (clear sky)
-1.226
Enhanced water vapor absorption
within the atmosphere
LW (clear sky)
+4.568
Direct and indirect radiative forcing
through GHG and water vapor
SW cloud forcing
-0.581
Larger cloud albedo
LW cloud forcing
-1.038
Competition by enhanced water
vapor absorption in the atmosphere
Net SFC radiation
+ 1.723
Net SFC heat
+ 1.109
Almost identical to net TOA radiation
GHG forcing (SFC)
0.548
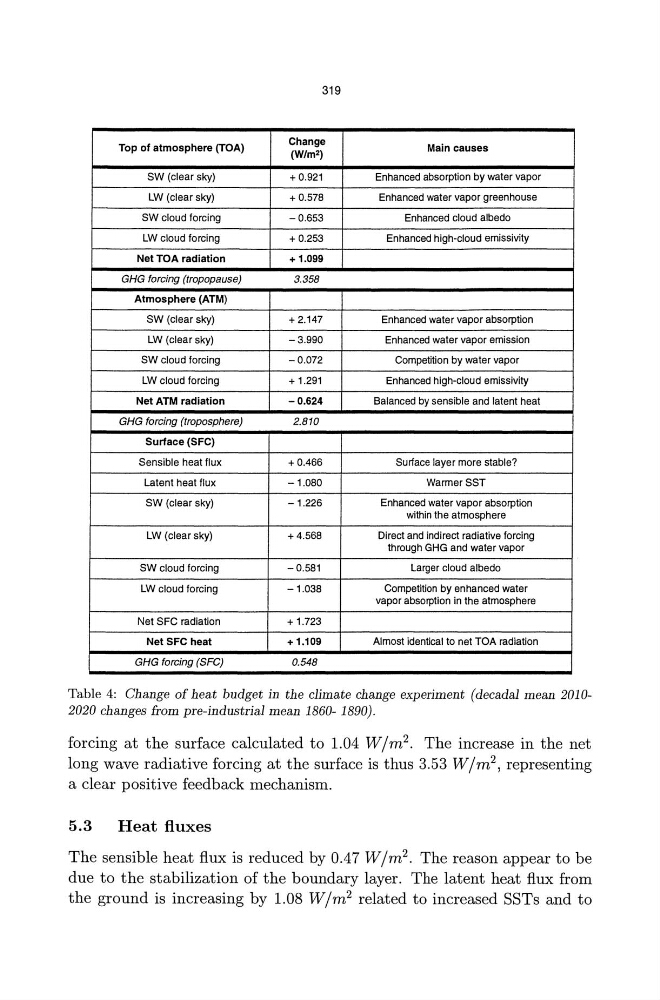
Table 4: Change of heat budget in the climate change experiment (decadal mean 20102020 changes from pre-industrial mean 1860- 1890).
forcing at the surface calculated to 1.04 Wjm 2 • The increase in the net
long wave radiative forcing at the surface is thus 3.53 Wjm 2 , representing
a clear positive feedback mechanism.
5.3
Heat fluxes
The sensible heat flux is reduced by 0.47 Wjm 2 . The reason appear to be
due to the stabilization of the boundary layer. The latent heat flux from
the ground is increasing by 1.08 Wjm 2 related to increased SSTs and to
Top of atmosphere (TOA)
Change
Main causes
(W/m2)
SW (clear sky)
+ 0.921
Enhanced absorption by water vapor
LW (clear sky)
+ 0.578
Enhanced water vapor greenhouse
SW cloud forcing
-0.653
Enhanced cloud albedo
LW cloud forcing
+ 0.253
Enhanced high-cloud emissivity
Net TOA radiation
+ 1.099
GHG forcing (tropopause)
3.358
Atmosphere (ATM)
SW (clear sky)
+2.147
Enhanced water vapor absorption
LW (clear sky)
-3.990
Enhanced water vapor emission
SW cloud forcing
-0.072
Competition by water vapor
LW cloud forcing
+ 1.291
Enhanced high-cloud emissivity
Net ATM radiation
-0.624
Balanced by sensible and latent heat
GHG forcing (troposphere)
2.810
Surface (SFC)
Sensible heat flux
+0.466
Sulface layer more stable?
Latent heat flux
-1.080
Warmer SST
SW (clear sky)
-1.226
Enhanced water vapor absorption
within the atmosphere
LW (clear sky)
+4.568
Direct and indirect radiative forcing
through GHG and water vapor
SW cloud forcing
-0.581
Larger cloud albedo
LW cloud forcing
-1.038
Competition by enhanced water
vapor absorption in the atmosphere
Net SFC radiation
+ 1.723
Net SFC heat
+ 1.109
Almost identical to net TOA radiation
GHG forcing (SFC)
0.548
Table 4: Change of heat budget in the climate change experiment (decadal mean 20102020 changes from pre-industrial mean 1860- 1890).
forcing at the surface calculated to 1.04 Wjm 2 • The increase in the net
long wave radiative forcing at the surface is thus 3.53 Wjm 2 , representing
a clear positive feedback mechanism.
5.3
Heat fluxes
The sensible heat flux is reduced by 0.47 Wjm 2 . The reason appear to be
due to the stabilization of the boundary layer. The latent heat flux from
the ground is increasing by 1.08 Wjm 2 related to increased SSTs and to