

unit: 1000 km 3 per year
above = predicted changes
below = coupled model resu"
3 .2
322
Global water cycle
Vapour Transport
3.0
38
76 Transpiration
Groundwater flow
4.0
Evaporation 451
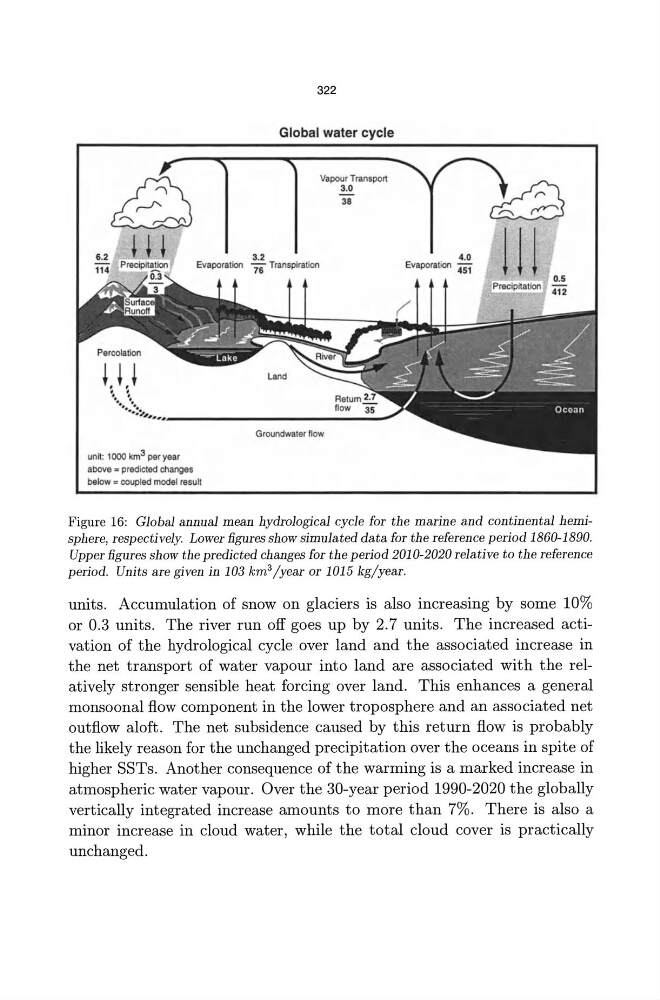
Figure 16: Global annual mean hydrological cycle for the marine and continental hemisphere, respectively. Lower figures show simulated data for the reference period 1860-1890.
Upper figures show the predicted changes for the period 2010-2020 relative to the reference
period. Units are given in 103 km 3 /year or 1015 kg/year.
units. Accumulation of snow on glaciers is also increasing by some 10%
or 0.3 units. The river run off goes up by 2.7 units. The increased activation of the hydrological cycle over land and the associated increase in
the net transport of water vapour into land are associated with the relatively stronger sensible heat forcing over land. This enhances a general
monsoonal flow component in the lower troposphere and an associated net
outflow aloft. The net subsidence caused by this return flow is probably
the likely reason for the unchanged precipitation over the oceans in spite of
higher SSTs. Another consequence of the warming is a marked increase in
atmospheric water vapour. Over the 30-year period 1990-2020 the globally
vertically integrated increase amounts to more than 7%. There is also a
minor increase in cloud water, while the total cloud cover is practically
unchanged.
above = predicted changes
below = coupled model resu"
3 .2
322
Global water cycle
Vapour Transport
3.0
38
76 Transpiration
Groundwater flow
4.0
Evaporation 451
Figure 16: Global annual mean hydrological cycle for the marine and continental hemisphere, respectively. Lower figures show simulated data for the reference period 1860-1890.
Upper figures show the predicted changes for the period 2010-2020 relative to the reference
period. Units are given in 103 km 3 /year or 1015 kg/year.
units. Accumulation of snow on glaciers is also increasing by some 10%
or 0.3 units. The river run off goes up by 2.7 units. The increased activation of the hydrological cycle over land and the associated increase in
the net transport of water vapour into land are associated with the relatively stronger sensible heat forcing over land. This enhances a general
monsoonal flow component in the lower troposphere and an associated net
outflow aloft. The net subsidence caused by this return flow is probably
the likely reason for the unchanged precipitation over the oceans in spite of
higher SSTs. Another consequence of the warming is a marked increase in
atmospheric water vapour. Over the 30-year period 1990-2020 the globally
vertically integrated increase amounts to more than 7%. There is also a
minor increase in cloud water, while the total cloud cover is practically
unchanged.