

313
0.3
0.2
0.2
0.1
0.1
0.0
0.0
-0.1
-0.1
-0.2
-0.2
- 0.3 +--.,.---.,.---,---,---,-----,,-----r----r---,--t - 0.3
100
120
140
160
180
200
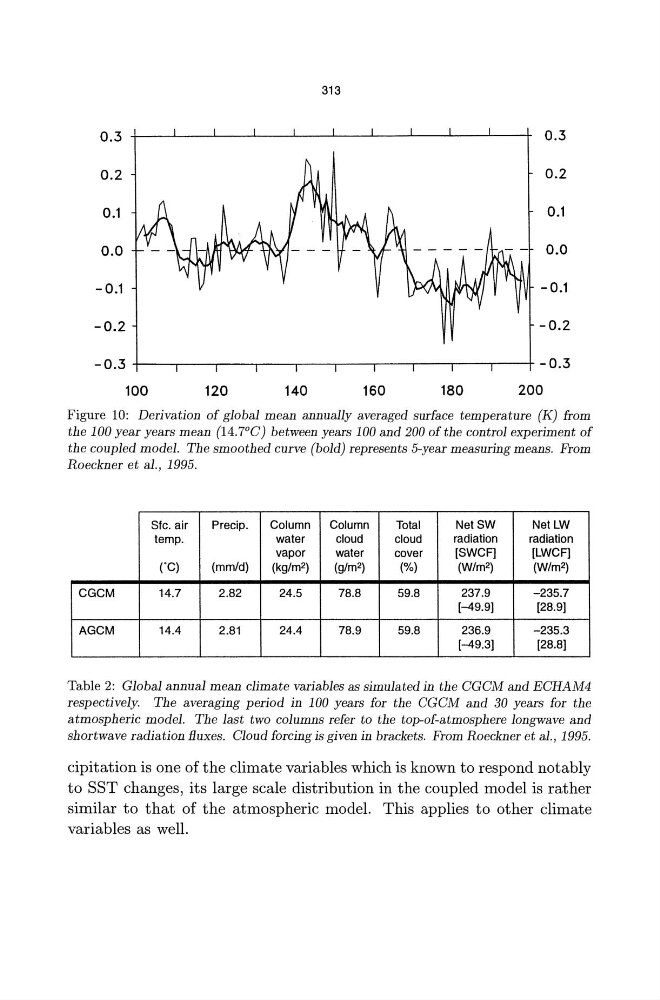
Figure 10: Derivation of global mean annually averaged surface temperature (K) from
the 100 year years mean (14.7°C) between years 100 and 200 of the control experiment of
the coupled model. The smoothed curve (bold) represents 5-year measuring means. From
Roeckner et aI., 1995.
Sfc. air
Precip.
Column
Column
Total
NetSW
NetLW
temp.
water
cloud
cloud
radiation
radiation
vapor
water
cover
[SWCF]
[LWCF]
eC)
(mm/d)
(kg/m2)
(91m2)
(%)
(W/m2)
(W/m2)
CGCM
14.7
2.82
24.5
78.8
59.8
237.9
-235.7
[-49.9]
[28.9]
AGCM
14.4
2.81
24.4
78.9
59.8
236.9
-235.3
[-49.3]
[28.8]
Table 2: Global annual mean climate variables as simulated in the CGCM and ECHAM4
respectively. The averaging period in 100 years for the CGCM and 30 years for the
atmospheric model. The last two columns refer to the top-of-atmosphere longwave and
shortwave radiation fluxes. Cloud forcing is given in brackets. From Roeckner et al., 1995.
cipitation is one of the climate variables which is known to respond notably
to SST changes, its large scale distribution in the coupled model is rather
similar to that of the atmospheric model. This applies to other climate
variables as well.
0.3
0.2
0.2
0.1
0.1
0.0
0.0
-0.1
-0.1
-0.2
-0.2
- 0.3 +--.,.---.,.---,---,---,-----,,-----r----r---,--t - 0.3
100
120
140
160
180
200
Figure 10: Derivation of global mean annually averaged surface temperature (K) from
the 100 year years mean (14.7°C) between years 100 and 200 of the control experiment of
the coupled model. The smoothed curve (bold) represents 5-year measuring means. From
Roeckner et aI., 1995.
Sfc. air
Precip.
Column
Column
Total
NetSW
NetLW
temp.
water
cloud
cloud
radiation
radiation
vapor
water
cover
[SWCF]
[LWCF]
eC)
(mm/d)
(kg/m2)
(91m2)
(%)
(W/m2)
(W/m2)
CGCM
14.7
2.82
24.5
78.8
59.8
237.9
-235.7
[-49.9]
[28.9]
AGCM
14.4
2.81
24.4
78.9
59.8
236.9
-235.3
[-49.3]
[28.8]
Table 2: Global annual mean climate variables as simulated in the CGCM and ECHAM4
respectively. The averaging period in 100 years for the CGCM and 30 years for the
atmospheric model. The last two columns refer to the top-of-atmosphere longwave and
shortwave radiation fluxes. Cloud forcing is given in brackets. From Roeckner et al., 1995.
cipitation is one of the climate variables which is known to respond notably
to SST changes, its large scale distribution in the coupled model is rather
similar to that of the atmospheric model. This applies to other climate
variables as well.