

314
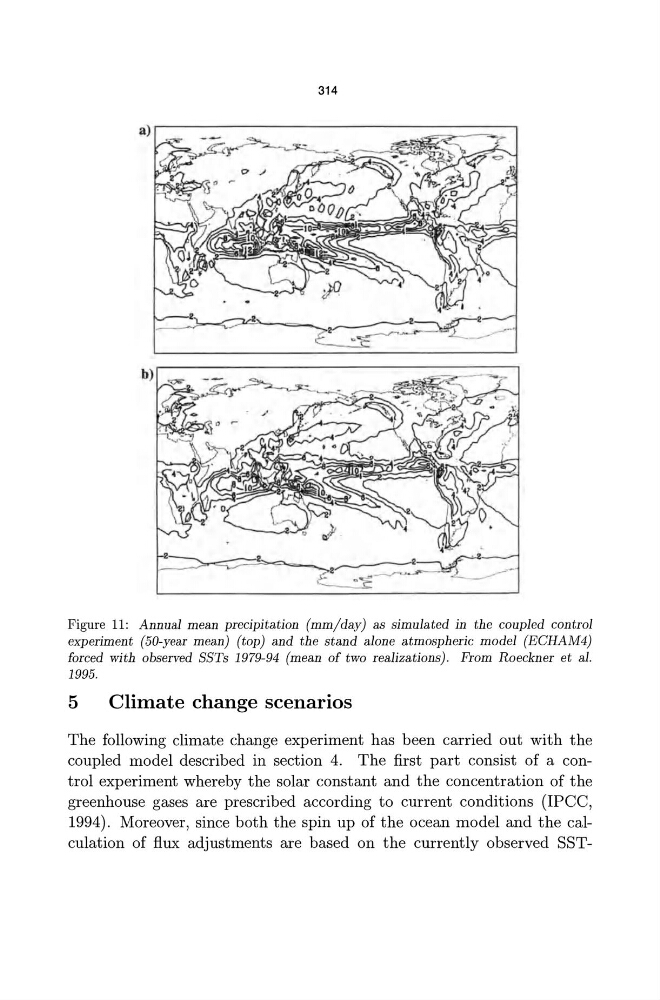
Figure 11 : Annual mean precipitation (mm/day) as simulated in the coupled control
experiment (50-year mean) (top) and the stand alone atmospheric model (ECHAM4)
forced with observed SSTs 1979-94 (mean of two realizations). From Roeckner et al.
1995.
5
Climate change scenarios
The following climate change experiment has been carried out with the
coupled model described in section 4. The first part consist of a control experiment whereby the solar constant and the concentration of the
greenhouse gases are prescribed according to current conditions (IPCC ,
1994). Moreover, since both the spin up of the ocean model and the calculation of flux adjustments are based on the currently observed SST-
Figure 11 : Annual mean precipitation (mm/day) as simulated in the coupled control
experiment (50-year mean) (top) and the stand alone atmospheric model (ECHAM4)
forced with observed SSTs 1979-94 (mean of two realizations). From Roeckner et al.
1995.
5
Climate change scenarios
The following climate change experiment has been carried out with the
coupled model described in section 4. The first part consist of a control experiment whereby the solar constant and the concentration of the
greenhouse gases are prescribed according to current conditions (IPCC ,
1994). Moreover, since both the spin up of the ocean model and the calculation of flux adjustments are based on the currently observed SST-