

306
Business as usual
(IPCC - Scenario A)
-2
0
2
4
6
Temperature change 1985 - 2085 in 'C
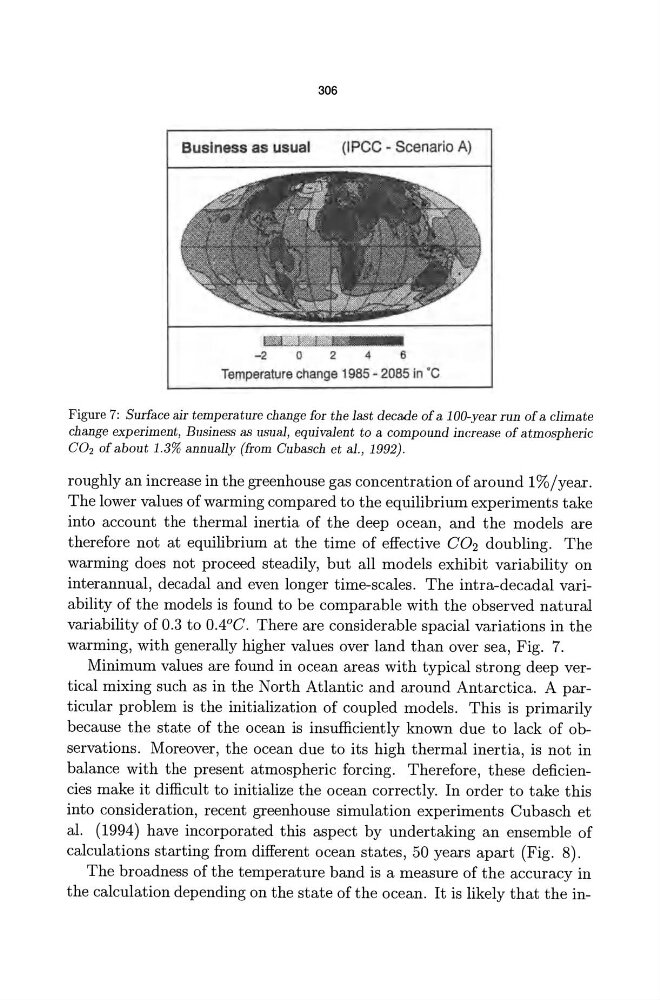
Figure 7: Surface air temperature change for the last decade of a 1 DO-year run of a climate
change experiment, Business as usual, equivalent to a compound increase of atmospheric
CO2 of about 1.3% annually (from Cubasch et a1., 1992).
roughly an increase in the greenhouse gas concentration of around 1 %/year.
The lower values of warming compared to the equilibrium experiments take
into account the thermal inertia of the deep ocean, and the models are
therefore not at equilibrium at the time of effective CO2 doubling. The
warming does not proceed steadily, but all models exhibit variability on
interannual, decadal and even longer time-scales. The intra-decadal variability of the models is found to be comparable with the observed natural
variability of 0.3 to O.4°C. There are considerable spacial variations in the
warming, with generally higher values over land than over sea, Fig. 7.
Minimum values are found in ocean areas with typical strong deep vertical mixing such as in the North Atlantic and around Antarctica. A particular problem is the initialization of coupled models. This is primarily
because the state of the ocean is insufficiently known due to lack of observations. Moreover, the ocean due to its high thermal inertia, is not in
balance with the present atmospheric forcing. Therefore, these deficiencies make it difficult to initialize the ocean correctly. In order to take this
into consideration, recent greenhouse simulation experiments Cubasch et
al. (1994) have incorporated this aspect by undertaking an ensemble of
calculations starting from different ocean states, 50 years apart (Fig. 8).
The broadness of the temperature band is a measure of the accuracy in
the calculation depending on the state of the ocean. It is likely that the in-
Business as usual
(IPCC - Scenario A)
-2
0
2
4
6
Temperature change 1985 - 2085 in 'C
Figure 7: Surface air temperature change for the last decade of a 1 DO-year run of a climate
change experiment, Business as usual, equivalent to a compound increase of atmospheric
CO2 of about 1.3% annually (from Cubasch et a1., 1992).
roughly an increase in the greenhouse gas concentration of around 1 %/year.
The lower values of warming compared to the equilibrium experiments take
into account the thermal inertia of the deep ocean, and the models are
therefore not at equilibrium at the time of effective CO2 doubling. The
warming does not proceed steadily, but all models exhibit variability on
interannual, decadal and even longer time-scales. The intra-decadal variability of the models is found to be comparable with the observed natural
variability of 0.3 to O.4°C. There are considerable spacial variations in the
warming, with generally higher values over land than over sea, Fig. 7.
Minimum values are found in ocean areas with typical strong deep vertical mixing such as in the North Atlantic and around Antarctica. A particular problem is the initialization of coupled models. This is primarily
because the state of the ocean is insufficiently known due to lack of observations. Moreover, the ocean due to its high thermal inertia, is not in
balance with the present atmospheric forcing. Therefore, these deficiencies make it difficult to initialize the ocean correctly. In order to take this
into consideration, recent greenhouse simulation experiments Cubasch et
al. (1994) have incorporated this aspect by undertaking an ensemble of
calculations starting from different ocean states, 50 years apart (Fig. 8).
The broadness of the temperature band is a measure of the accuracy in
the calculation depending on the state of the ocean. It is likely that the in-