

215
34.904
·0.6
a
WGSP
b
. 34.900
(""~ ~j!
34.896
-1.0
-1.20
34.892
34.888
-1.4
-1.25
\/~
-1.8
-1.30
34.82
34.87
34.92
1950
1960
1970
1980
1890
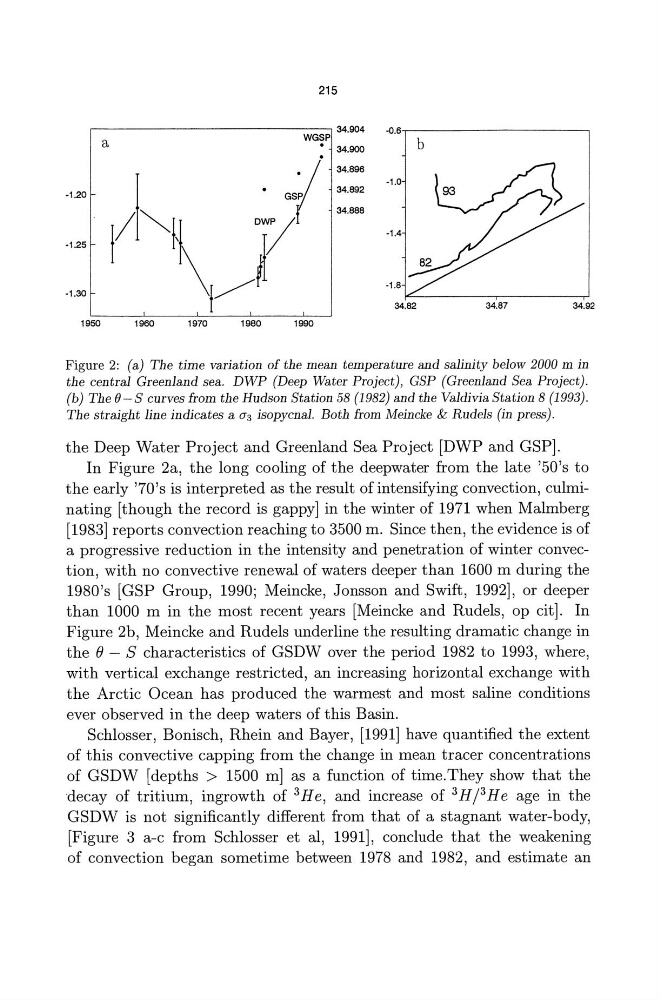
Figure 2: (a) The time variation of the mean temperature and salinity below 2000 m in
the central Greenland sea. DWP (Deep Water Project), GSP (Greenland Sea Project).
(b) The (J-S curves from the Hudson Station 58 (1982) and the Valdivia Station 8 (1993).
The straight line indicates a 0"3 isopycnal. Both from Meincke & Rudels (in press).
the Deep Water Project and Greenland Sea Project [DWP and GSP].
In Figure 2a, the long cooling of the deepwater from the late '50's to
the early '70's is interpreted as the result of intensifying convection, culminating [though the record is gappy] in the winter of 1971 when Malmberg
[1983] reports convection reaching to 3500 m. Since then, the evidence is of
a progressive reduction in the intensity and penetration of winter convection, with no convective renewal of waters deeper than 1600 m during the
1980's [GSP Group, 1990; Meincke, Jonsson and Swift, 1992], or deeper
than 1000 m in the most recent years [Meincke and Rudels, op cit]. In
Figure 2b, Meincke and Rudels underline the resulting dramatic change in
the e - S characteristics of GSDW over the period 1982 to 1993, where,
with vertical exchange restricted, an increasing horizontal exchange with
the Arctic Ocean has produced the warmest and most saline conditions
ever observed in the deep waters of this Basin.
Schlosser, Bonisch, Rhein and Bayer, [1991] have quantified the extent
of this convective capping from the change in mean tracer concentrations
of GSDW [depths> 1500 m] as a function of time.They show that the
decay of tritium, ingrowth of 3 He, and increase of 3 H j3 He age in the
GSDW is not significantly different from that of a stagnant water-body,
[Figure 3 a-c from Schlosser et aI, 1991], conclude that the weakening
of convection began sometime between 1978 and 1982, and estimate an
34.904
·0.6
a
WGSP
b
. 34.900
(""~ ~j!
34.896
-1.0
-1.20
34.892
34.888
-1.4
-1.25
\/~
-1.8
-1.30
34.82
34.87
34.92
1950
1960
1970
1980
1890
Figure 2: (a) The time variation of the mean temperature and salinity below 2000 m in
the central Greenland sea. DWP (Deep Water Project), GSP (Greenland Sea Project).
(b) The (J-S curves from the Hudson Station 58 (1982) and the Valdivia Station 8 (1993).
The straight line indicates a 0"3 isopycnal. Both from Meincke & Rudels (in press).
the Deep Water Project and Greenland Sea Project [DWP and GSP].
In Figure 2a, the long cooling of the deepwater from the late '50's to
the early '70's is interpreted as the result of intensifying convection, culminating [though the record is gappy] in the winter of 1971 when Malmberg
[1983] reports convection reaching to 3500 m. Since then, the evidence is of
a progressive reduction in the intensity and penetration of winter convection, with no convective renewal of waters deeper than 1600 m during the
1980's [GSP Group, 1990; Meincke, Jonsson and Swift, 1992], or deeper
than 1000 m in the most recent years [Meincke and Rudels, op cit]. In
Figure 2b, Meincke and Rudels underline the resulting dramatic change in
the e - S characteristics of GSDW over the period 1982 to 1993, where,
with vertical exchange restricted, an increasing horizontal exchange with
the Arctic Ocean has produced the warmest and most saline conditions
ever observed in the deep waters of this Basin.
Schlosser, Bonisch, Rhein and Bayer, [1991] have quantified the extent
of this convective capping from the change in mean tracer concentrations
of GSDW [depths> 1500 m] as a function of time.They show that the
decay of tritium, ingrowth of 3 He, and increase of 3 H j3 He age in the
GSDW is not significantly different from that of a stagnant water-body,
[Figure 3 a-c from Schlosser et aI, 1991], conclude that the weakening
of convection began sometime between 1978 and 1982, and estimate an