

216
I
I
B_
t
A
1.5 I~!
1.5
I!
-
-
::;)
::;)
t:.
!
t:. 1
CD
1 -
-
::J:
::J:
M
C?
0.5
0.5 -
-
I
I
C
-a::I
>20
-
-
r
- ~
CD
"0
C)
E
~
Co
CD
-
::J:
,..
c:t.
!
,..
•
::J: 10 -
_LL
M
I
1970 1980 1990 2000
Year
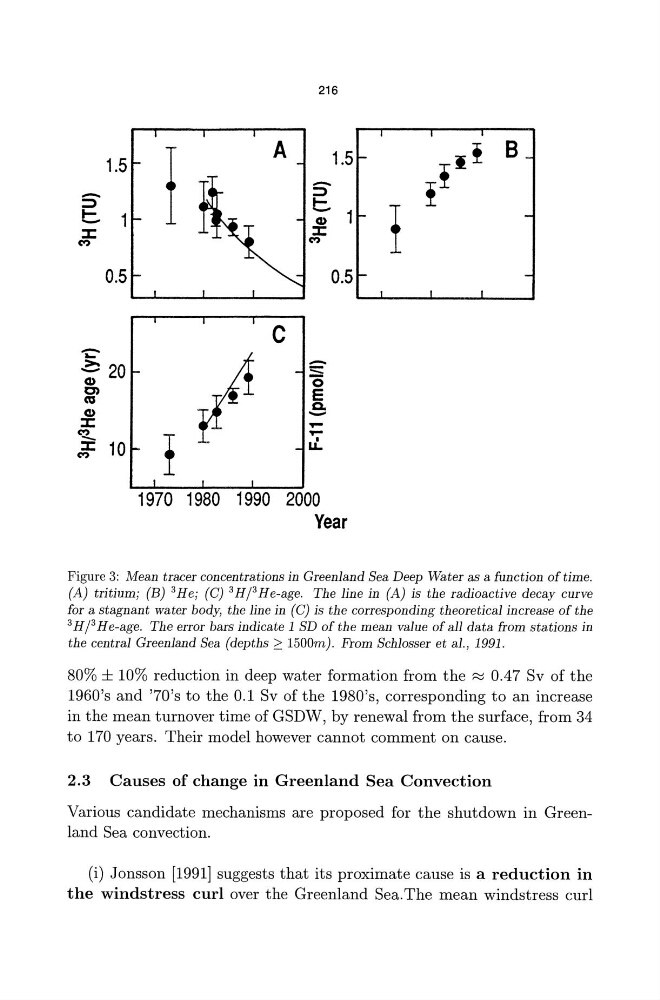
Figure 3: Mean tracer concentrations in Greenland Sea Deep Water as a function of time.
(A) tritium; (B) 3He; (0) 3Hj3He-age. The line in (A) is the radioactive decay curve
for a stagnant water body, the line in (0) is the corresponding theoretical increase of the
3 H /3 He-age. The error bars indicate 1 SD of the mean value of all data from stations in
the central Greenland Sea (depths:::: 1500m). From Schlosser et al., 1991.
80% ± 10% reduction in deep water formation from the ~ 0.47 Sv of the
1960's and '70's to the 0.1 Sv of the 1980's, corresponding to an increase
in the mean turnover time of GSDW, by renewal from the surface, from 34
to 170 years. Their model however cannot comment on cause.
2.3 Causes of change in Greenland Sea Convection
Various candidate mechanisms are proposed for the shutdown in Greenland Sea convection.
(i) Jonsson [1991] suggests that its proximate cause is a reduction in
the windstress curl over the Greenland Sea. The mean windstress curl
I
I
B_
t
A
1.5 I~!
1.5
I!
-
-
::;)
::;)
t:.
!
t:. 1
CD
1 -
-
::J:
::J:
M
C?
0.5
0.5 -
-
I
I
C
-a::I
>20
-
-
r
- ~
CD
"0
C)
E
~
Co
CD
-
::J:
,..
c:t.
!
,..
•
::J: 10 -
_LL
M
I
1970 1980 1990 2000
Year
Figure 3: Mean tracer concentrations in Greenland Sea Deep Water as a function of time.
(A) tritium; (B) 3He; (0) 3Hj3He-age. The line in (A) is the radioactive decay curve
for a stagnant water body, the line in (0) is the corresponding theoretical increase of the
3 H /3 He-age. The error bars indicate 1 SD of the mean value of all data from stations in
the central Greenland Sea (depths:::: 1500m). From Schlosser et al., 1991.
80% ± 10% reduction in deep water formation from the ~ 0.47 Sv of the
1960's and '70's to the 0.1 Sv of the 1980's, corresponding to an increase
in the mean turnover time of GSDW, by renewal from the surface, from 34
to 170 years. Their model however cannot comment on cause.
2.3 Causes of change in Greenland Sea Convection
Various candidate mechanisms are proposed for the shutdown in Greenland Sea convection.
(i) Jonsson [1991] suggests that its proximate cause is a reduction in
the windstress curl over the Greenland Sea. The mean windstress curl