

w
o
REFERENCE TEMPS
60
40 .. , ...
20 .. : ... < ..... ;
::>
.
.
I0 ,,: ... . ; ... : .. . ..
5
-20
-40
-60
o 10 20
DEG-C
(al
186
SURFACE H20 FLUX
EASTWARD STRESS
60
40 ·
40
20 ., ..... , .... .
20
o ......... ..
-20
-40 ·
-40
.... · · ..
- 60
-1
0
MlYR
-0.5
0
0.5
Pu
(bl
(el
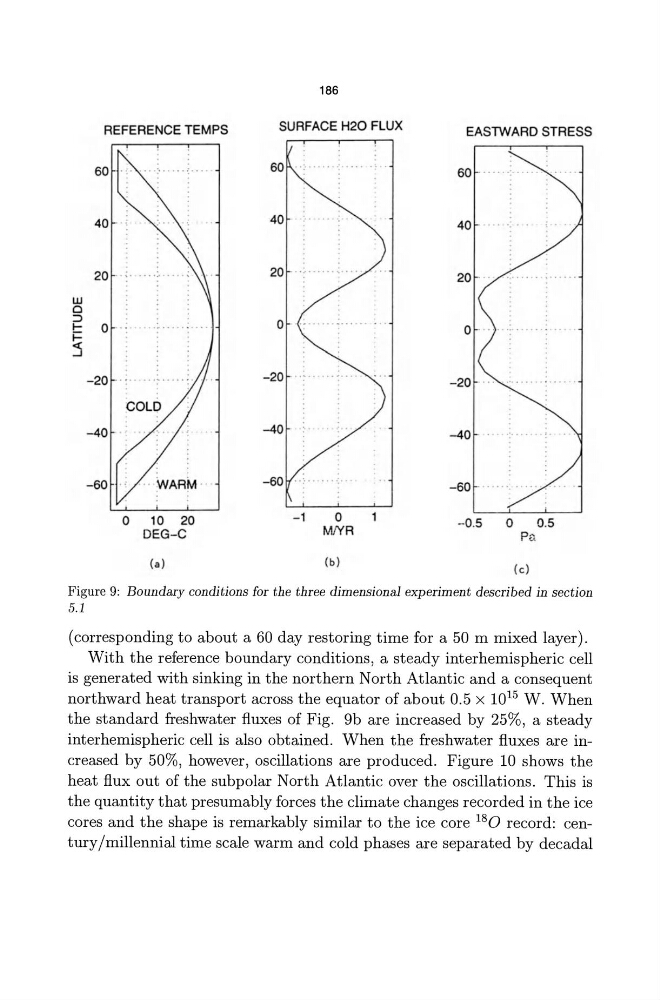
Figure 9: Boundary conditions for the three dimensional experiment described in section
5.1
( corresponding to about a 60 day restoring time for a 50 m mixed layer) .
With the reference boundary conditions, a steady interhemispheric cell
is generated with sinking in the northern North Atlantic and a consequent
northward heat transport across the equator of about 0.5 x 10 15 W. When
the standard freshwater fluxes of Fig. 9b are increased by 25%, a steady
interhemispheric cell is also obtained. When the freshwater fluxes are increased by 50%, however, oscillations are produced. Figure 10 shows the
heat flux out of the subpolar North Atlantic over the oscillations. This is
the quantity that presumably forces the climate changes recorded in the ice
cores and the shape is remarkably similar to the ice core 18 0 record: century /millennial time scale warm and cold phases are separated by decadal
o
REFERENCE TEMPS
60
40 .. , ...
20 .. : ... < ..... ;
::>
.
.
I0 ,,: ... . ; ... : .. . ..
5
-20
-40
-60
o 10 20
DEG-C
(al
186
SURFACE H20 FLUX
EASTWARD STRESS
60
40 ·
40
20 ., ..... , .... .
20
o ......... ..
-20
-40 ·
-40
.... · · ..
- 60
-1
0
MlYR
-0.5
0
0.5
Pu
(bl
(el
Figure 9: Boundary conditions for the three dimensional experiment described in section
5.1
( corresponding to about a 60 day restoring time for a 50 m mixed layer) .
With the reference boundary conditions, a steady interhemispheric cell
is generated with sinking in the northern North Atlantic and a consequent
northward heat transport across the equator of about 0.5 x 10 15 W. When
the standard freshwater fluxes of Fig. 9b are increased by 25%, a steady
interhemispheric cell is also obtained. When the freshwater fluxes are increased by 50%, however, oscillations are produced. Figure 10 shows the
heat flux out of the subpolar North Atlantic over the oscillations. This is
the quantity that presumably forces the climate changes recorded in the ice
cores and the shape is remarkably similar to the ice core 18 0 record: century /millennial time scale warm and cold phases are separated by decadal