

70
M. Senami and A. Fukushima
α
i
α
i
α
i
α
i
SiH 4
PH 3
H 2 S
HCl
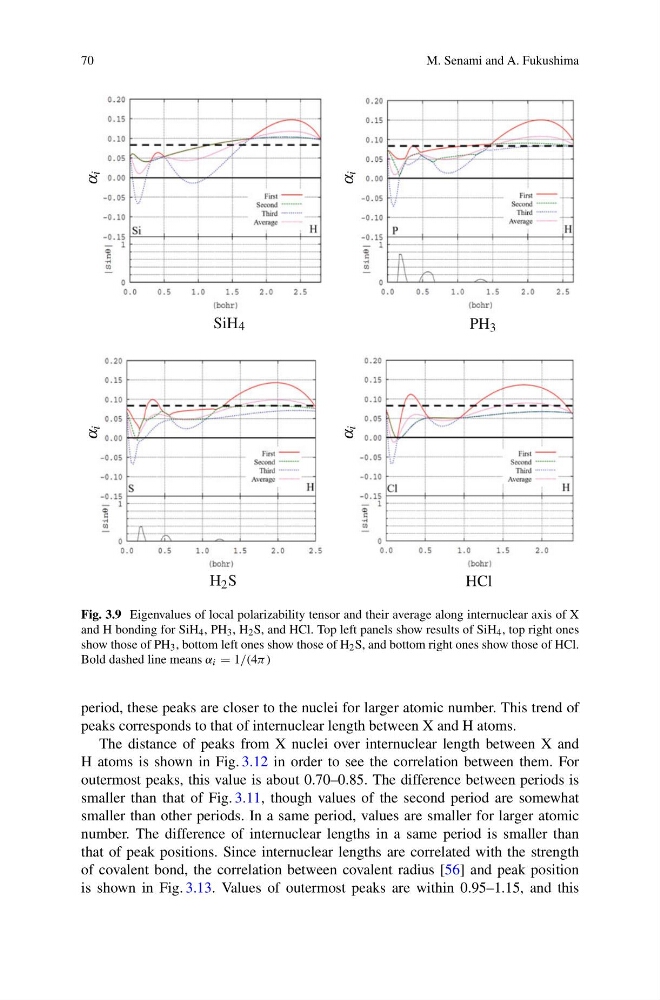
Fig. 3.9 Eigenvalues of local polarizability tensor and their average along internuclear axis of X
and H bonding for SiH 4 , PH 3 , H 2 S, and HCl. Top left panels show results of SiH 4 , top right ones
show those of PH 3 , bottom left ones show those of H 2 S, and bottom right ones show those of HCl.
Bold dashed line means α i = 1/(4π)
period, these peaks are closer to the nuclei for larger atomic number. This trend of
peaks corresponds to that of internuclear length between X and H atoms.
The distance of peaks from X nuclei over internuclear length between X and
H atoms is shown in Fig. 3.12 in order to see the correlation between them. For
outermost peaks, this value is about 0.70–0.85. The difference between periods is
smaller than that of Fig. 3.11, though values of the second period are somewhat
smaller than other periods. In a same period, values are smaller for larger atomic
number. The difference of internuclear lengths in a same period is smaller than
that of peak positions. Since internuclear lengths are correlated with the strength
of covalent bond, the correlation between covalent radius [56] and peak position
is shown in Fig. 3.13. Values of outermost peaks are within 0.95–1.15, and this
M. Senami and A. Fukushima
α
i
α
i
α
i
α
i
SiH 4
PH 3
H 2 S
HCl
Fig. 3.9 Eigenvalues of local polarizability tensor and their average along internuclear axis of X
and H bonding for SiH 4 , PH 3 , H 2 S, and HCl. Top left panels show results of SiH 4 , top right ones
show those of PH 3 , bottom left ones show those of H 2 S, and bottom right ones show those of HCl.
Bold dashed line means α i = 1/(4π)
period, these peaks are closer to the nuclei for larger atomic number. This trend of
peaks corresponds to that of internuclear length between X and H atoms.
The distance of peaks from X nuclei over internuclear length between X and
H atoms is shown in Fig. 3.12 in order to see the correlation between them. For
outermost peaks, this value is about 0.70–0.85. The difference between periods is
smaller than that of Fig. 3.11, though values of the second period are somewhat
smaller than other periods. In a same period, values are smaller for larger atomic
number. The difference of internuclear lengths in a same period is smaller than
that of peak positions. Since internuclear lengths are correlated with the strength
of covalent bond, the correlation between covalent radius [56] and peak position
is shown in Fig. 3.13. Values of outermost peaks are within 0.95–1.15, and this