

3 Local Dielectric Constant Density Analysis of High-k Dielectric Nanomaterial
69
α
i
CH 4
α
i
NH 3
α
i
H 2 O
α
i
HF
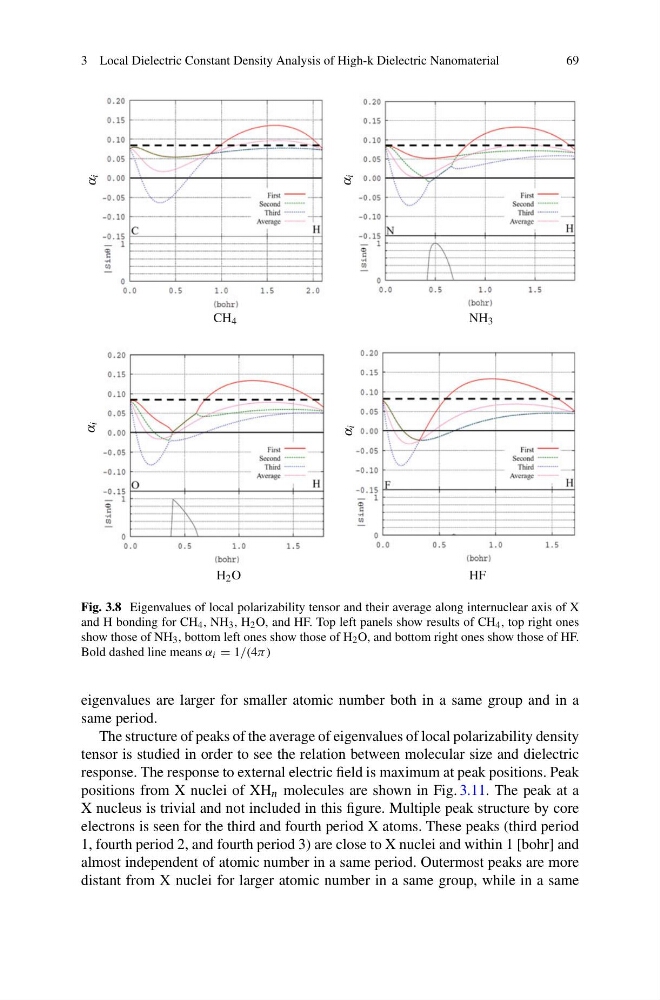
Fig. 3.8 Eigenvalues of local polarizability tensor and their average along internuclear axis of X
and H bonding for CH 4 , NH 3 , H 2 O, and HF. Top left panels show results of CH 4 , top right ones
show those of NH 3 , bottom left ones show those of H 2 O, and bottom right ones show those of HF.
Bold dashed line means α i = 1/(4π)
eigenvalues are larger for smaller atomic number both in a same group and in a
same period.
The structure of peaks of the average of eigenvalues of local polarizability density
tensor is studied in order to see the relation between molecular size and dielectric
response. The response to external electric field is maximum at peak positions. Peak
positions from X nuclei of XH n molecules are shown in Fig. 3.11. The peak at a
X nucleus is trivial and not included in this figure. Multiple peak structure by core
electrons is seen for the third and fourth period X atoms. These peaks (third period
1, fourth period 2, and fourth period 3) are close to X nuclei and within 1 [bohr] and
almost independent of atomic number in a same period. Outermost peaks are more
distant from X nuclei for larger atomic number in a same group, while in a same
69
α
i
CH 4
α
i
NH 3
α
i
H 2 O
α
i
HF
Fig. 3.8 Eigenvalues of local polarizability tensor and their average along internuclear axis of X
and H bonding for CH 4 , NH 3 , H 2 O, and HF. Top left panels show results of CH 4 , top right ones
show those of NH 3 , bottom left ones show those of H 2 O, and bottom right ones show those of HF.
Bold dashed line means α i = 1/(4π)
eigenvalues are larger for smaller atomic number both in a same group and in a
same period.
The structure of peaks of the average of eigenvalues of local polarizability density
tensor is studied in order to see the relation between molecular size and dielectric
response. The response to external electric field is maximum at peak positions. Peak
positions from X nuclei of XH n molecules are shown in Fig. 3.11. The peak at a
X nucleus is trivial and not included in this figure. Multiple peak structure by core
electrons is seen for the third and fourth period X atoms. These peaks (third period
1, fourth period 2, and fourth period 3) are close to X nuclei and within 1 [bohr] and
almost independent of atomic number in a same period. Outermost peaks are more
distant from X nuclei for larger atomic number in a same group, while in a same