

434
H. Kobayashi
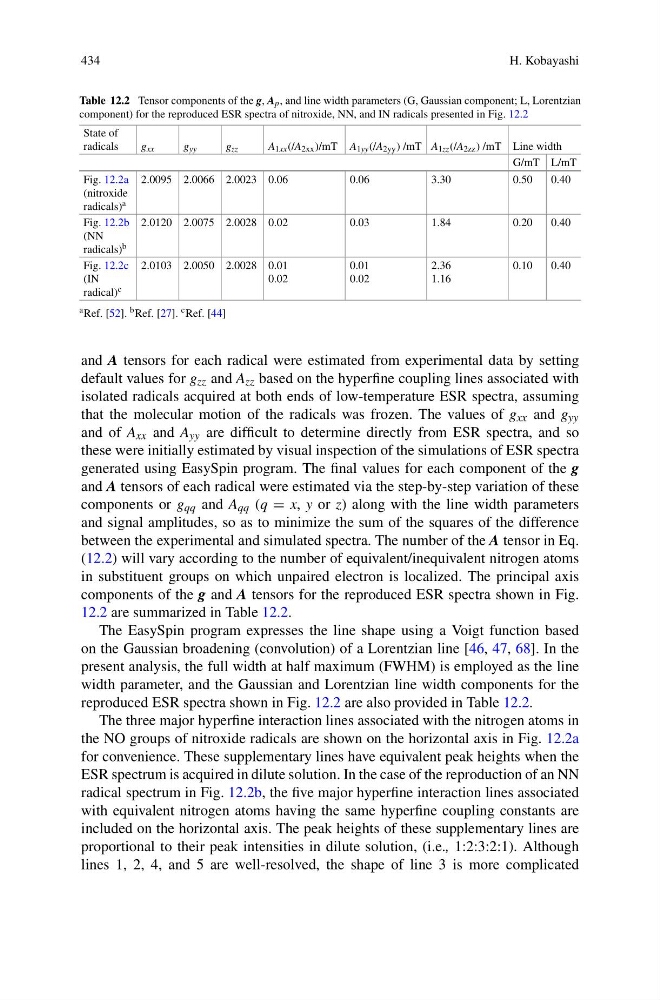
Table 12.2 Tensor components of the g, A p , and line width parameters (G, Gaussian component; L, Lorentzian
component) for the reproduced ESR spectra of nitroxide, NN, and IN radicals presented in Fig. 12.2
State of
radicals
g xx
g yy
g zz
A 1xx (/A 2xx )/mT A 1yy (/A 2yy ) /mT A 1zz (/A 2zz ) /mT Line width
G/mT L/mT
Fig. 12.2a
(nitroxide
radicals) a
2.0095 2.0066 2.0023 0.06
0.06
3.30
0.50
0.40
Fig. 12.2b
(NN
radicals) b
2.0120 2.0075 2.0028 0.02
0.03
1.84
0.20
0.40
Fig. 12.2c
(IN
radical) c
2.0103 2.0050 2.0028 0.01
0.02
0.01
0.02
2.36
1.16
0.10
0.40
a Ref. [52]. b Ref. [27]. c Ref. [44]
and A tensors for each radical were estimated from experimental data by setting
default values for g zz and A zz based on the hyperfine coupling lines associated with
isolated radicals acquired at both ends of low-temperature ESR spectra, assuming
that the molecular motion of the radicals was frozen. The values of g xx and g yy
and of A xx and A yy are difficult to determine directly from ESR spectra, and so
these were initially estimated by visual inspection of the simulations of ESR spectra
generated using EasySpin program. The final values for each component of the g
and A tensors of each radical were estimated via the step-by-step variation of these
components or g qq and A qq (q = x, y or z) along with the line width parameters
and signal amplitudes, so as to minimize the sum of the squares of the difference
between the experimental and simulated spectra. The number of the A tensor in Eq.
(12.2) will vary according to the number of equivalent/inequivalent nitrogen atoms
in substituent groups on which unpaired electron is localized. The principal axis
components of the g and A tensors for the reproduced ESR spectra shown in Fig.
12.2 are summarized in Table 12.2.
The EasySpin program expresses the line shape using a Voigt function based
on the Gaussian broadening (convolution) of a Lorentzian line [46, 47, 68]. In the
present analysis, the full width at half maximum (FWHM) is employed as the line
width parameter, and the Gaussian and Lorentzian line width components for the
reproduced ESR spectra shown in Fig. 12.2 are also provided in Table 12.2.
The three major hyperfine interaction lines associated with the nitrogen atoms in
the NO groups of nitroxide radicals are shown on the horizontal axis in Fig. 12.2a
for convenience. These supplementary lines have equivalent peak heights when the
ESR spectrum is acquired in dilute solution. In the case of the reproduction of an NN
radical spectrum in Fig. 12.2b, the five major hyperfine interaction lines associated
with equivalent nitrogen atoms having the same hyperfine coupling constants are
included on the horizontal axis. The peak heights of these supplementary lines are
proportional to their peak intensities in dilute solution, (i.e., 1:2:3:2:1). Although
lines 1, 2, 4, and 5 are well-resolved, the shape of line 3 is more complicated
H. Kobayashi
Table 12.2 Tensor components of the g, A p , and line width parameters (G, Gaussian component; L, Lorentzian
component) for the reproduced ESR spectra of nitroxide, NN, and IN radicals presented in Fig. 12.2
State of
radicals
g xx
g yy
g zz
A 1xx (/A 2xx )/mT A 1yy (/A 2yy ) /mT A 1zz (/A 2zz ) /mT Line width
G/mT L/mT
Fig. 12.2a
(nitroxide
radicals) a
2.0095 2.0066 2.0023 0.06
0.06
3.30
0.50
0.40
Fig. 12.2b
(NN
radicals) b
2.0120 2.0075 2.0028 0.02
0.03
1.84
0.20
0.40
Fig. 12.2c
(IN
radical) c
2.0103 2.0050 2.0028 0.01
0.02
0.01
0.02
2.36
1.16
0.10
0.40
a Ref. [52]. b Ref. [27]. c Ref. [44]
and A tensors for each radical were estimated from experimental data by setting
default values for g zz and A zz based on the hyperfine coupling lines associated with
isolated radicals acquired at both ends of low-temperature ESR spectra, assuming
that the molecular motion of the radicals was frozen. The values of g xx and g yy
and of A xx and A yy are difficult to determine directly from ESR spectra, and so
these were initially estimated by visual inspection of the simulations of ESR spectra
generated using EasySpin program. The final values for each component of the g
and A tensors of each radical were estimated via the step-by-step variation of these
components or g qq and A qq (q = x, y or z) along with the line width parameters
and signal amplitudes, so as to minimize the sum of the squares of the difference
between the experimental and simulated spectra. The number of the A tensor in Eq.
(12.2) will vary according to the number of equivalent/inequivalent nitrogen atoms
in substituent groups on which unpaired electron is localized. The principal axis
components of the g and A tensors for the reproduced ESR spectra shown in Fig.
12.2 are summarized in Table 12.2.
The EasySpin program expresses the line shape using a Voigt function based
on the Gaussian broadening (convolution) of a Lorentzian line [46, 47, 68]. In the
present analysis, the full width at half maximum (FWHM) is employed as the line
width parameter, and the Gaussian and Lorentzian line width components for the
reproduced ESR spectra shown in Fig. 12.2 are also provided in Table 12.2.
The three major hyperfine interaction lines associated with the nitrogen atoms in
the NO groups of nitroxide radicals are shown on the horizontal axis in Fig. 12.2a
for convenience. These supplementary lines have equivalent peak heights when the
ESR spectrum is acquired in dilute solution. In the case of the reproduction of an NN
radical spectrum in Fig. 12.2b, the five major hyperfine interaction lines associated
with equivalent nitrogen atoms having the same hyperfine coupling constants are
included on the horizontal axis. The peak heights of these supplementary lines are
proportional to their peak intensities in dilute solution, (i.e., 1:2:3:2:1). Although
lines 1, 2, 4, and 5 are well-resolved, the shape of line 3 is more complicated