

10 New Na + Superionic Conductor Narpsio Glass-Ceramics
405
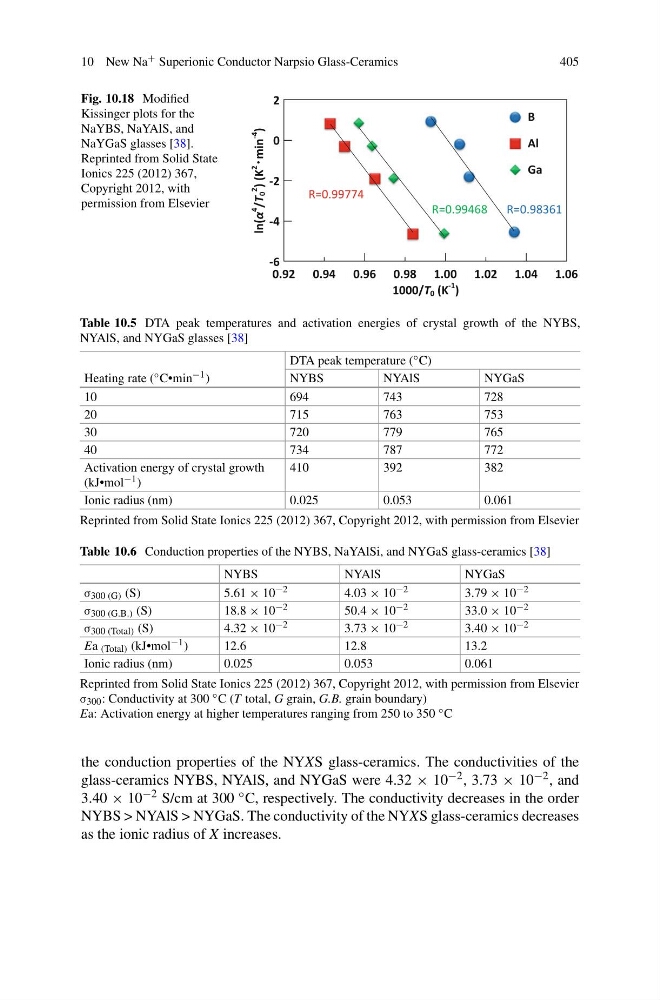
Fig. 10.18 Modified
Kissinger plots for the
NaYBS, NaYAlS, and
NaYGaS glasses [38].
Reprinted from Solid State
Ionics 225 (2012) 367,
Copyright 2012, with
permission from Elsevier
B
Al
Ga
0.92
ln(α
4
/T
0
2
) (K
2
min
-4
)
1.00
1.04
0.96
1000/T 0 (K
-1 )
2
0
-2
-4
-6
1.06
1.02
0.98
0.94
R=0.99774
R=0.99468 R=0.98361
Table 10.5 DTA peak temperatures and activation energies of crystal growth of the NYBS,
NYAlS, and NYGaS glasses [38]
DTA peak temperature ( ◦ C)
Heating rate ( ◦ C•min −1 )
NYBS
NYAlS
NYGaS
10
694
743
728
20
715
763
753
30
720
779
765
40
734
787
772
Activation energy of crystal growth
(kJ•mol −1 )
410
392
382
Ionic radius (nm)
0.025
0.053
0.061
Reprinted from Solid State Ionics 225 (2012) 367, Copyright 2012, with permission from Elsevier
Table 10.6 Conduction properties of the NYBS, NaYAlSi, and NYGaS glass-ceramics [38]
NYBS
NYAlS
NYGaS
σ 300 (G) (S)
5.61 × 10 −2
4.03 × 10 −2
3.79 × 10 −2
σ 300 (G.B.) (S)
18.8 × 10 −2
50.4 × 10 −2
33.0 × 10 −2
σ 300 (Total) (S)
4.32 × 10 −2
3.73 × 10 −2
3.40 × 10 −2
Ea (Total) (kJ•mol −1 )
12.6
12.8
13.2
Ionic radius (nm)
0.025
0.053
0.061
Reprinted from Solid State Ionics 225 (2012) 367, Copyright 2012, with permission from Elsevier
σ 300 : Conductivity at 300 ◦ C (T total, G grain, G.B. grain boundary)
Ea: Activation energy at higher temperatures ranging from 250 to 350 ◦ C
the conduction properties of the NYXS glass-ceramics. The conductivities of the
glass-ceramics NYBS, NYAlS, and NYGaS were 4.32 × 10 −2 , 3.73 × 10 −2 , and
3.40 × 10 −2 S/cm at 300 ◦ C, respectively. The conductivity decreases in the order
NYBS > NYAlS > NYGaS. The conductivity of the NYXS glass-ceramics decreases
as the ionic radius of X increases.
405
Fig. 10.18 Modified
Kissinger plots for the
NaYBS, NaYAlS, and
NaYGaS glasses [38].
Reprinted from Solid State
Ionics 225 (2012) 367,
Copyright 2012, with
permission from Elsevier
B
Al
Ga
0.92
ln(α
4
/T
0
2
) (K
2
min
-4
)
1.00
1.04
0.96
1000/T 0 (K
-1 )
2
0
-2
-4
-6
1.06
1.02
0.98
0.94
R=0.99774
R=0.99468 R=0.98361
Table 10.5 DTA peak temperatures and activation energies of crystal growth of the NYBS,
NYAlS, and NYGaS glasses [38]
DTA peak temperature ( ◦ C)
Heating rate ( ◦ C•min −1 )
NYBS
NYAlS
NYGaS
10
694
743
728
20
715
763
753
30
720
779
765
40
734
787
772
Activation energy of crystal growth
(kJ•mol −1 )
410
392
382
Ionic radius (nm)
0.025
0.053
0.061
Reprinted from Solid State Ionics 225 (2012) 367, Copyright 2012, with permission from Elsevier
Table 10.6 Conduction properties of the NYBS, NaYAlSi, and NYGaS glass-ceramics [38]
NYBS
NYAlS
NYGaS
σ 300 (G) (S)
5.61 × 10 −2
4.03 × 10 −2
3.79 × 10 −2
σ 300 (G.B.) (S)
18.8 × 10 −2
50.4 × 10 −2
33.0 × 10 −2
σ 300 (Total) (S)
4.32 × 10 −2
3.73 × 10 −2
3.40 × 10 −2
Ea (Total) (kJ•mol −1 )
12.6
12.8
13.2
Ionic radius (nm)
0.025
0.053
0.061
Reprinted from Solid State Ionics 225 (2012) 367, Copyright 2012, with permission from Elsevier
σ 300 : Conductivity at 300 ◦ C (T total, G grain, G.B. grain boundary)
Ea: Activation energy at higher temperatures ranging from 250 to 350 ◦ C
the conduction properties of the NYXS glass-ceramics. The conductivities of the
glass-ceramics NYBS, NYAlS, and NYGaS were 4.32 × 10 −2 , 3.73 × 10 −2 , and
3.40 × 10 −2 S/cm at 300 ◦ C, respectively. The conductivity decreases in the order
NYBS > NYAlS > NYGaS. The conductivity of the NYXS glass-ceramics decreases
as the ionic radius of X increases.