

10 New Na + Superionic Conductor Narpsio Glass-Ceramics
403
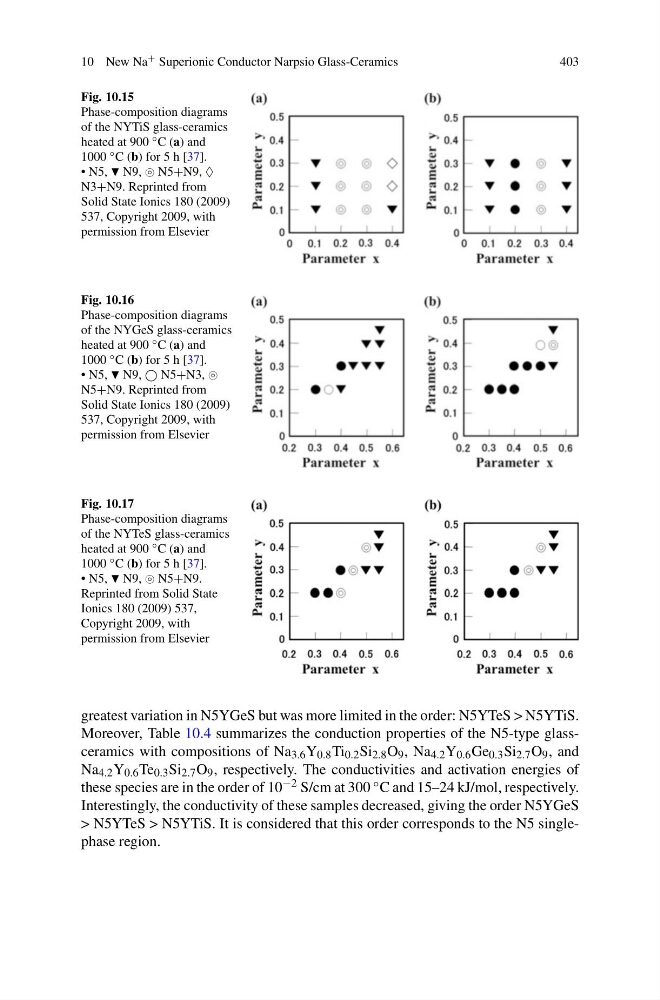
Fig. 10.15
Phase-composition diagrams
of the NYTiS glass-ceramics
heated at 900 ◦ C (a) and
1000 ◦ C (b) for 5 h [37].
• N5, N9, N5+N9, ♦
N3+N9. Reprinted from
Solid State Ionics 180 (2009)
537, Copyright 2009, with
permission from Elsevier
Fig. 10.16
Phase-composition diagrams
of the NYGeS glass-ceramics
heated at 900 ◦ C (a) and
1000 ◦ C (b) for 5 h [37].
• N5, N9, N5+N3,
N5+N9. Reprinted from
Solid State Ionics 180 (2009)
537, Copyright 2009, with
permission from Elsevier
Fig. 10.17
Phase-composition diagrams
of the NYTeS glass-ceramics
heated at 900 ◦ C (a) and
1000 ◦ C (b) for 5 h [37].
• N5, N9, N5+N9.
Reprinted from Solid State
Ionics 180 (2009) 537,
Copyright 2009, with
permission from Elsevier
greatest variation in N5YGeS but was more limited in the order: N5YTeS > N5YTiS.
Moreover, Table 10.4 summarizes the conduction properties of the N5-type glassceramics with compositions of Na 3.6 Y 0.8 Ti 0.2 Si 2.8 O 9 , Na 4.2 Y 0.6 Ge 0.3 Si 2.7 O 9 , and
Na 4.2 Y 0.6 Te 0.3 Si 2.7 O 9 , respectively. The conductivities and activation energies of
these species are in the order of 10 −2 S/cm at 300 ◦ C and 15–24 kJ/mol, respectively.
Interestingly, the conductivity of these samples decreased, giving the order N5YGeS
> N5YTeS > N5YTiS. It is considered that this order corresponds to the N5 singlephase region.
403
Fig. 10.15
Phase-composition diagrams
of the NYTiS glass-ceramics
heated at 900 ◦ C (a) and
1000 ◦ C (b) for 5 h [37].
• N5, N9, N5+N9, ♦
N3+N9. Reprinted from
Solid State Ionics 180 (2009)
537, Copyright 2009, with
permission from Elsevier
Fig. 10.16
Phase-composition diagrams
of the NYGeS glass-ceramics
heated at 900 ◦ C (a) and
1000 ◦ C (b) for 5 h [37].
• N5, N9, N5+N3,
N5+N9. Reprinted from
Solid State Ionics 180 (2009)
537, Copyright 2009, with
permission from Elsevier
Fig. 10.17
Phase-composition diagrams
of the NYTeS glass-ceramics
heated at 900 ◦ C (a) and
1000 ◦ C (b) for 5 h [37].
• N5, N9, N5+N9.
Reprinted from Solid State
Ionics 180 (2009) 537,
Copyright 2009, with
permission from Elsevier
greatest variation in N5YGeS but was more limited in the order: N5YTeS > N5YTiS.
Moreover, Table 10.4 summarizes the conduction properties of the N5-type glassceramics with compositions of Na 3.6 Y 0.8 Ti 0.2 Si 2.8 O 9 , Na 4.2 Y 0.6 Ge 0.3 Si 2.7 O 9 , and
Na 4.2 Y 0.6 Te 0.3 Si 2.7 O 9 , respectively. The conductivities and activation energies of
these species are in the order of 10 −2 S/cm at 300 ◦ C and 15–24 kJ/mol, respectively.
Interestingly, the conductivity of these samples decreased, giving the order N5YGeS
> N5YTeS > N5YTiS. It is considered that this order corresponds to the N5 singlephase region.