

10 New Na + Superionic Conductor Narpsio Glass-Ceramics
401
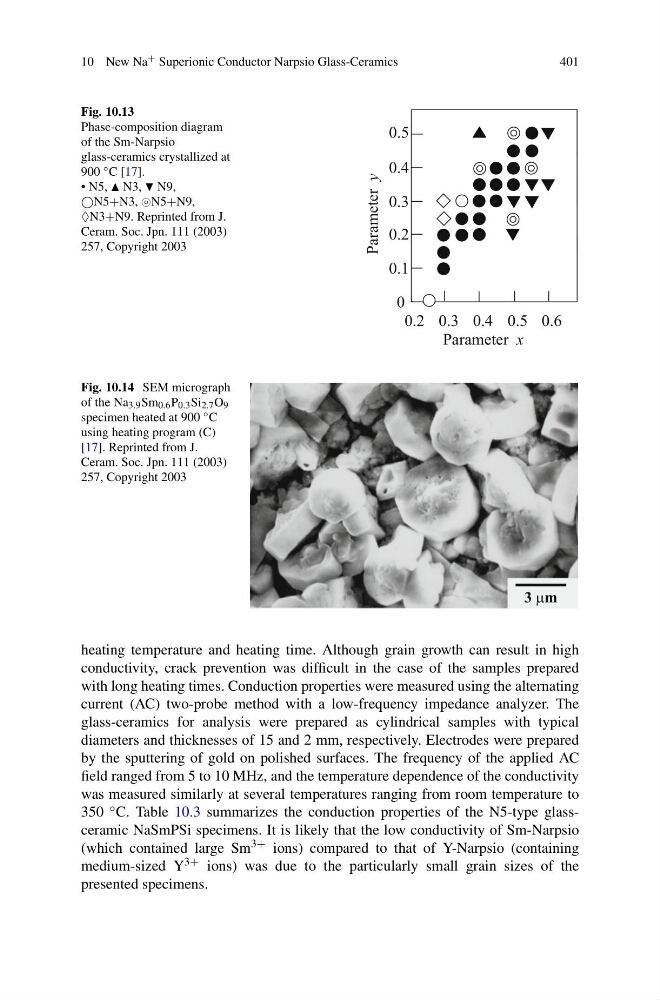
Fig. 10.13
Phase-composition diagram
of the Sm-Narpsio
glass-ceramics crystallized at
900 ◦ C [17].
• N5, N3, N9,
N5+N3, N5+N9,
♦N3+N9. Reprinted from J.
Ceram. Soc. Jpn. 111 (2003)
257, Copyright 2003
0
0.1
0.2
0.3
0.4
0.5
0.2 0.3 0.4 0.5 0.6
Parameter x
Parameter y
Fig. 10.14 SEM micrograph
of the Na 3.9 Sm 0.6 P 0.3 Si 2.7 O 9
specimen heated at 900 ◦ C
using heating program (C)
[17]. Reprinted from J.
Ceram. Soc. Jpn. 111 (2003)
257, Copyright 2003
3 m
heating temperature and heating time. Although grain growth can result in high
conductivity, crack prevention was difficult in the case of the samples prepared
with long heating times. Conduction properties were measured using the alternating
current (AC) two-probe method with a low-frequency impedance analyzer. The
glass-ceramics for analysis were prepared as cylindrical samples with typical
diameters and thicknesses of 15 and 2 mm, respectively. Electrodes were prepared
by the sputtering of gold on polished surfaces. The frequency of the applied AC
field ranged from 5 to 10 MHz, and the temperature dependence of the conductivity
was measured similarly at several temperatures ranging from room temperature to
350 ◦ C. Table 10.3 summarizes the conduction properties of the N5-type glassceramic NaSmPSi specimens. It is likely that the low conductivity of Sm-Narpsio
(which contained large Sm 3+ ions) compared to that of Y-Narpsio (containing
medium-sized Y 3+ ions) was due to the particularly small grain sizes of the
presented specimens.
401
Fig. 10.13
Phase-composition diagram
of the Sm-Narpsio
glass-ceramics crystallized at
900 ◦ C [17].
• N5, N3, N9,
N5+N3, N5+N9,
♦N3+N9. Reprinted from J.
Ceram. Soc. Jpn. 111 (2003)
257, Copyright 2003
0
0.1
0.2
0.3
0.4
0.5
0.2 0.3 0.4 0.5 0.6
Parameter x
Parameter y
Fig. 10.14 SEM micrograph
of the Na 3.9 Sm 0.6 P 0.3 Si 2.7 O 9
specimen heated at 900 ◦ C
using heating program (C)
[17]. Reprinted from J.
Ceram. Soc. Jpn. 111 (2003)
257, Copyright 2003
3 m
heating temperature and heating time. Although grain growth can result in high
conductivity, crack prevention was difficult in the case of the samples prepared
with long heating times. Conduction properties were measured using the alternating
current (AC) two-probe method with a low-frequency impedance analyzer. The
glass-ceramics for analysis were prepared as cylindrical samples with typical
diameters and thicknesses of 15 and 2 mm, respectively. Electrodes were prepared
by the sputtering of gold on polished surfaces. The frequency of the applied AC
field ranged from 5 to 10 MHz, and the temperature dependence of the conductivity
was measured similarly at several temperatures ranging from room temperature to
350 ◦ C. Table 10.3 summarizes the conduction properties of the N5-type glassceramic NaSmPSi specimens. It is likely that the low conductivity of Sm-Narpsio
(which contained large Sm 3+ ions) compared to that of Y-Narpsio (containing
medium-sized Y 3+ ions) was due to the particularly small grain sizes of the
presented specimens.