

10 New Na + Superionic Conductor Narpsio Glass-Ceramics
393
Free energy
T
T
Tc
Tc
(a)
(b)
N5
N5
N3 (N9)
N3 (N9)
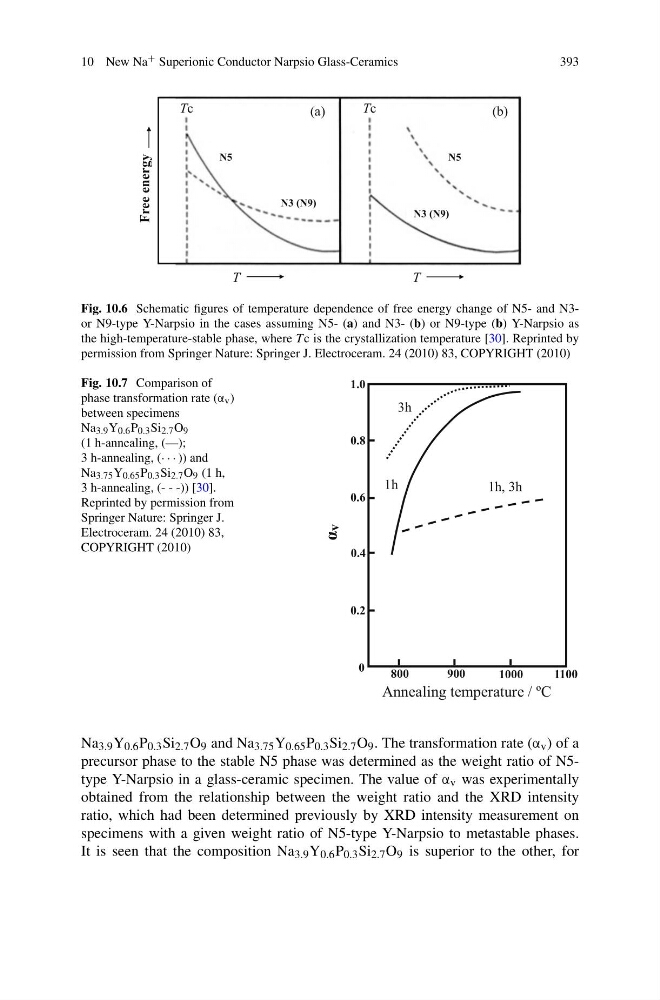
Fig. 10.6 Schematic figures of temperature dependence of free energy change of N5- and N3or N9-type Y-Narpsio in the cases assuming N5- (a) and N3- (b) or N9-type (b) Y-Narpsio as
the high-temperature-stable phase, where Tc is the crystallization temperature [30]. Reprinted by
permission from Springer Nature: Springer J. Electroceram. 24 (2010) 83, COPYRIGHT (2010)
Fig. 10.7 Comparison of
phase transformation rate (α v )
between specimens
Na 3.9 Y 0.6 P 0.3 Si 2.7 O 9
(1 h-annealing, (—);
3 h-annealing, (· · · )) and
Na 3.75 Y 0.65 P 0.3 Si 2.7 O 9 (1 h,
3 h-annealing, (- - -)) [30].
Reprinted by permission from
Springer Nature: Springer J.
Electroceram. 24 (2010) 83,
COPYRIGHT (2010)
1.0
0.8
0.6
0.4
0.2
Annealing temperature / ºC
900
1000
1100
800
0
α
v
1h
3h
1h, 3h
Na 3.9 Y 0.6 P 0.3 Si 2.7 O 9 and Na 3.75 Y 0.65 P 0.3 Si 2.7 O 9 . The transformation rate (α v ) of a
precursor phase to the stable N5 phase was determined as the weight ratio of N5type Y-Narpsio in a glass-ceramic specimen. The value of α v was experimentally
obtained from the relationship between the weight ratio and the XRD intensity
ratio, which had been determined previously by XRD intensity measurement on
specimens with a given weight ratio of N5-type Y-Narpsio to metastable phases.
It is seen that the composition Na 3.9 Y 0.6 P 0.3 Si 2.7 O 9 is superior to the other, for
393
Free energy
T
T
Tc
Tc
(a)
(b)
N5
N5
N3 (N9)
N3 (N9)
Fig. 10.6 Schematic figures of temperature dependence of free energy change of N5- and N3or N9-type Y-Narpsio in the cases assuming N5- (a) and N3- (b) or N9-type (b) Y-Narpsio as
the high-temperature-stable phase, where Tc is the crystallization temperature [30]. Reprinted by
permission from Springer Nature: Springer J. Electroceram. 24 (2010) 83, COPYRIGHT (2010)
Fig. 10.7 Comparison of
phase transformation rate (α v )
between specimens
Na 3.9 Y 0.6 P 0.3 Si 2.7 O 9
(1 h-annealing, (—);
3 h-annealing, (· · · )) and
Na 3.75 Y 0.65 P 0.3 Si 2.7 O 9 (1 h,
3 h-annealing, (- - -)) [30].
Reprinted by permission from
Springer Nature: Springer J.
Electroceram. 24 (2010) 83,
COPYRIGHT (2010)
1.0
0.8
0.6
0.4
0.2
Annealing temperature / ºC
900
1000
1100
800
0
α
v
1h
3h
1h, 3h
Na 3.9 Y 0.6 P 0.3 Si 2.7 O 9 and Na 3.75 Y 0.65 P 0.3 Si 2.7 O 9 . The transformation rate (α v ) of a
precursor phase to the stable N5 phase was determined as the weight ratio of N5type Y-Narpsio in a glass-ceramic specimen. The value of α v was experimentally
obtained from the relationship between the weight ratio and the XRD intensity
ratio, which had been determined previously by XRD intensity measurement on
specimens with a given weight ratio of N5-type Y-Narpsio to metastable phases.
It is seen that the composition Na 3.9 Y 0.6 P 0.3 Si 2.7 O 9 is superior to the other, for