

392
T. Okura and K. Yamashita
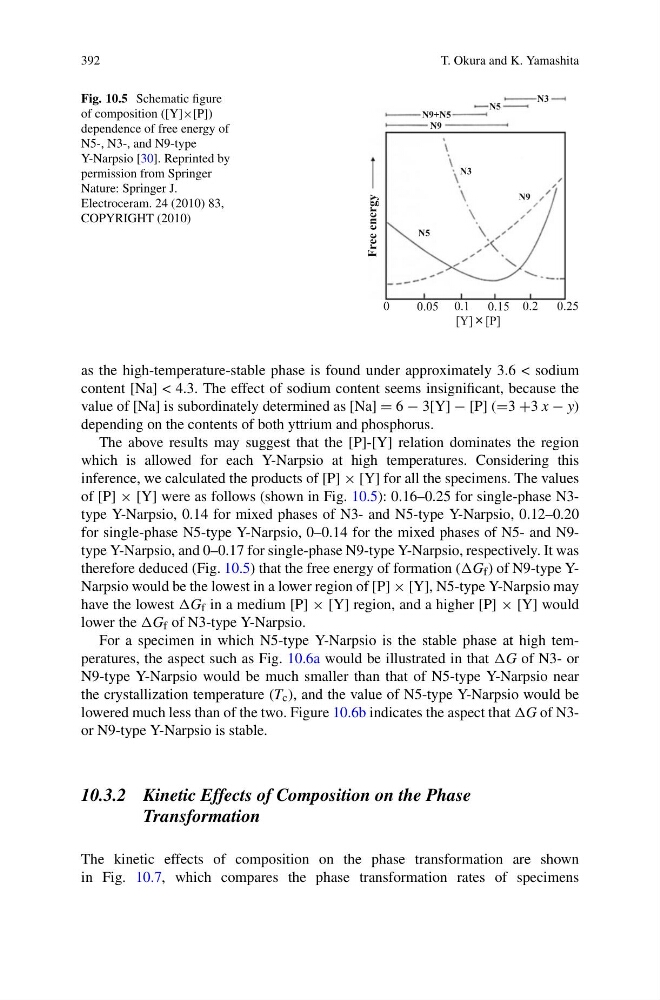
Fig. 10.5 Schematic figure
of composition ([Y]×[P])
dependence of free energy of
N5-, N3-, and N9-type
Y-Narpsio [30]. Reprinted by
permission from Springer
Nature: Springer J.
Electroceram. 24 (2010) 83,
COPYRIGHT (2010)
Free energy
[Y]㽢[P]
0.05
0
0.1 0.15 0.2
0.25
N3
N5
N9
N9+N5
N5
N3
N9
as the high-temperature-stable phase is found under approximately 3.6 < sodium
content [Na] < 4.3. The effect of sodium content seems insignificant, because the
value of [Na] is subordinately determined as [Na] = 6 − 3[Y] − [P] (=3 +3 x − y)
depending on the contents of both yttrium and phosphorus.
The above results may suggest that the [P]-[Y] relation dominates the region
which is allowed for each Y-Narpsio at high temperatures. Considering this
inference, we calculated the products of [P] × [Y] for all the specimens. The values
of [P] × [Y] were as follows (shown in Fig. 10.5): 0.16–0.25 for single-phase N3type Y-Narpsio, 0.14 for mixed phases of N3- and N5-type Y-Narpsio, 0.12–0.20
for single-phase N5-type Y-Narpsio, 0–0.14 for the mixed phases of N5- and N9type Y-Narpsio, and 0–0.17 for single-phase N9-type Y-Narpsio, respectively. It was
therefore deduced (Fig. 10.5) that the free energy of formation (G f ) of N9-type YNarpsio would be the lowest in a lower region of [P] × [Y], N5-type Y-Narpsio may
have the lowest G f in a medium [P] × [Y] region, and a higher [P] × [Y] would
lower the G f of N3-type Y-Narpsio.
For a specimen in which N5-type Y-Narpsio is the stable phase at high temperatures, the aspect such as Fig. 10.6a would be illustrated in that G of N3- or
N9-type Y-Narpsio would be much smaller than that of N5-type Y-Narpsio near
the crystallization temperature (T c ), and the value of N5-type Y-Narpsio would be
lowered much less than of the two. Figure 10.6b indicates the aspect that G of N3or N9-type Y-Narpsio is stable.
10.3.2 Kinetic Effects of Composition on the Phase
Transformation
The kinetic effects of composition on the phase transformation are shown
in Fig. 10.7, which compares the phase transformation rates of specimens
T. Okura and K. Yamashita
Fig. 10.5 Schematic figure
of composition ([Y]×[P])
dependence of free energy of
N5-, N3-, and N9-type
Y-Narpsio [30]. Reprinted by
permission from Springer
Nature: Springer J.
Electroceram. 24 (2010) 83,
COPYRIGHT (2010)
Free energy
[Y]㽢[P]
0.05
0
0.1 0.15 0.2
0.25
N3
N5
N9
N9+N5
N5
N3
N9
as the high-temperature-stable phase is found under approximately 3.6 < sodium
content [Na] < 4.3. The effect of sodium content seems insignificant, because the
value of [Na] is subordinately determined as [Na] = 6 − 3[Y] − [P] (=3 +3 x − y)
depending on the contents of both yttrium and phosphorus.
The above results may suggest that the [P]-[Y] relation dominates the region
which is allowed for each Y-Narpsio at high temperatures. Considering this
inference, we calculated the products of [P] × [Y] for all the specimens. The values
of [P] × [Y] were as follows (shown in Fig. 10.5): 0.16–0.25 for single-phase N3type Y-Narpsio, 0.14 for mixed phases of N3- and N5-type Y-Narpsio, 0.12–0.20
for single-phase N5-type Y-Narpsio, 0–0.14 for the mixed phases of N5- and N9type Y-Narpsio, and 0–0.17 for single-phase N9-type Y-Narpsio, respectively. It was
therefore deduced (Fig. 10.5) that the free energy of formation (G f ) of N9-type YNarpsio would be the lowest in a lower region of [P] × [Y], N5-type Y-Narpsio may
have the lowest G f in a medium [P] × [Y] region, and a higher [P] × [Y] would
lower the G f of N3-type Y-Narpsio.
For a specimen in which N5-type Y-Narpsio is the stable phase at high temperatures, the aspect such as Fig. 10.6a would be illustrated in that G of N3- or
N9-type Y-Narpsio would be much smaller than that of N5-type Y-Narpsio near
the crystallization temperature (T c ), and the value of N5-type Y-Narpsio would be
lowered much less than of the two. Figure 10.6b indicates the aspect that G of N3or N9-type Y-Narpsio is stable.
10.3.2 Kinetic Effects of Composition on the Phase
Transformation
The kinetic effects of composition on the phase transformation are shown
in Fig. 10.7, which compares the phase transformation rates of specimens