

390
T. Okura and K. Yamashita
rates of chemical reactions. For a single rate-limited thermally activated process,
an Arrhenius plot gives a straight line, from which the activation energy can be
determined. The temperature dependence Arrhenius plots were presented based on
the calculated conductivity values of grains and grain boundaries of the Narpsio
glass-ceramics.
Apparent activation energies for crystallization (crystal growth) were determined
by employing the non-isothermal-modified Kissinger methods [31, 32] in which
some characteristics of the crystallization peak determined by DTA were monitored
as a function of heating rate or temperature. The following relationship was then
applied.
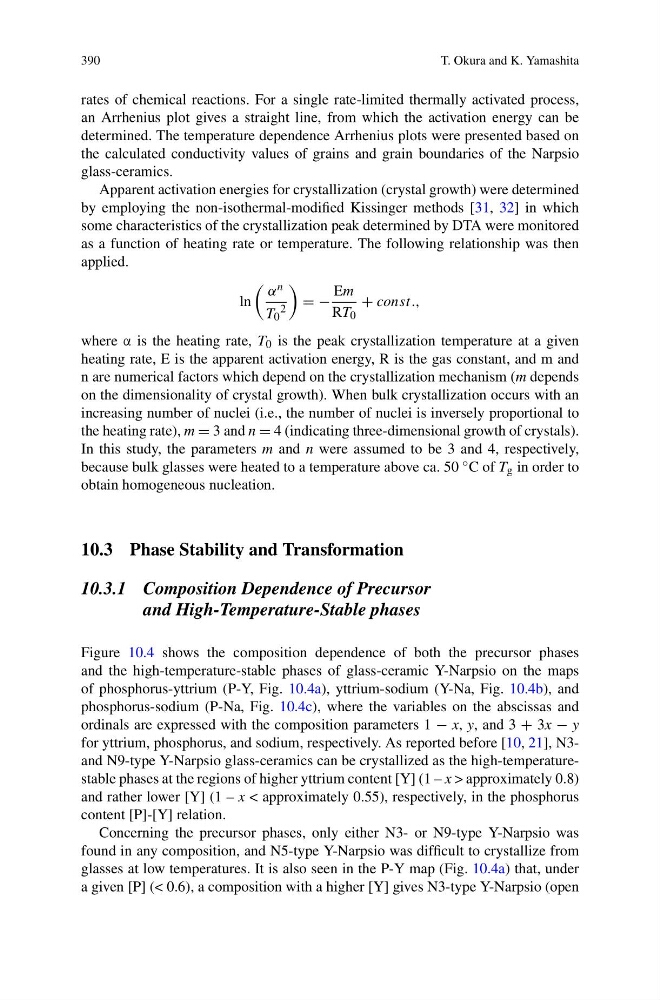
ln
α n
T 0
2
= −
Em
RT 0
+ const.,
where α is the heating rate, T 0 is the peak crystallization temperature at a given
heating rate, E is the apparent activation energy, R is the gas constant, and m and
n are numerical factors which depend on the crystallization mechanism (m depends
on the dimensionality of crystal growth). When bulk crystallization occurs with an
increasing number of nuclei (i.e., the number of nuclei is inversely proportional to
the heating rate), m = 3 and n = 4 (indicating three-dimensional growth of crystals).
In this study, the parameters m and n were assumed to be 3 and 4, respectively,
because bulk glasses were heated to a temperature above ca. 50 ◦ C of T g in order to
obtain homogeneous nucleation.
10.3 Phase Stability and Transformation
10.3.1 Composition Dependence of Precursor
and High-Temperature-Stable phases
Figure 10.4 shows the composition dependence of both the precursor phases
and the high-temperature-stable phases of glass-ceramic Y-Narpsio on the maps
of phosphorus-yttrium (P-Y, Fig. 10.4a), yttrium-sodium (Y-Na, Fig. 10.4b), and
phosphorus-sodium (P-Na, Fig. 10.4c), where the variables on the abscissas and
ordinals are expressed with the composition parameters 1 − x, y, and 3 + 3x − y
for yttrium, phosphorus, and sodium, respectively. As reported before [10, 21], N3and N9-type Y-Narpsio glass-ceramics can be crystallized as the high-temperaturestable phases at the regions of higher yttrium content [Y] (1 – x > approximately 0.8)
and rather lower [Y] (1 – x < approximately 0.55), respectively, in the phosphorus
content [P]-[Y] relation.
Concerning the precursor phases, only either N3- or N9-type Y-Narpsio was
found in any composition, and N5-type Y-Narpsio was difficult to crystallize from
glasses at low temperatures. It is also seen in the P-Y map (Fig. 10.4a) that, under
a given [P] (< 0.6), a composition with a higher [Y] gives N3-type Y-Narpsio (open
T. Okura and K. Yamashita
rates of chemical reactions. For a single rate-limited thermally activated process,
an Arrhenius plot gives a straight line, from which the activation energy can be
determined. The temperature dependence Arrhenius plots were presented based on
the calculated conductivity values of grains and grain boundaries of the Narpsio
glass-ceramics.
Apparent activation energies for crystallization (crystal growth) were determined
by employing the non-isothermal-modified Kissinger methods [31, 32] in which
some characteristics of the crystallization peak determined by DTA were monitored
as a function of heating rate or temperature. The following relationship was then
applied.
ln
α n
T 0
2
= −
Em
RT 0
+ const.,
where α is the heating rate, T 0 is the peak crystallization temperature at a given
heating rate, E is the apparent activation energy, R is the gas constant, and m and
n are numerical factors which depend on the crystallization mechanism (m depends
on the dimensionality of crystal growth). When bulk crystallization occurs with an
increasing number of nuclei (i.e., the number of nuclei is inversely proportional to
the heating rate), m = 3 and n = 4 (indicating three-dimensional growth of crystals).
In this study, the parameters m and n were assumed to be 3 and 4, respectively,
because bulk glasses were heated to a temperature above ca. 50 ◦ C of T g in order to
obtain homogeneous nucleation.
10.3 Phase Stability and Transformation
10.3.1 Composition Dependence of Precursor
and High-Temperature-Stable phases
Figure 10.4 shows the composition dependence of both the precursor phases
and the high-temperature-stable phases of glass-ceramic Y-Narpsio on the maps
of phosphorus-yttrium (P-Y, Fig. 10.4a), yttrium-sodium (Y-Na, Fig. 10.4b), and
phosphorus-sodium (P-Na, Fig. 10.4c), where the variables on the abscissas and
ordinals are expressed with the composition parameters 1 − x, y, and 3 + 3x − y
for yttrium, phosphorus, and sodium, respectively. As reported before [10, 21], N3and N9-type Y-Narpsio glass-ceramics can be crystallized as the high-temperaturestable phases at the regions of higher yttrium content [Y] (1 – x > approximately 0.8)
and rather lower [Y] (1 – x < approximately 0.55), respectively, in the phosphorus
content [P]-[Y] relation.
Concerning the precursor phases, only either N3- or N9-type Y-Narpsio was
found in any composition, and N5-type Y-Narpsio was difficult to crystallize from
glasses at low temperatures. It is also seen in the P-Y map (Fig. 10.4a) that, under
a given [P] (< 0.6), a composition with a higher [Y] gives N3-type Y-Narpsio (open