

378
Y. Kobayashi and H. Kobayashi
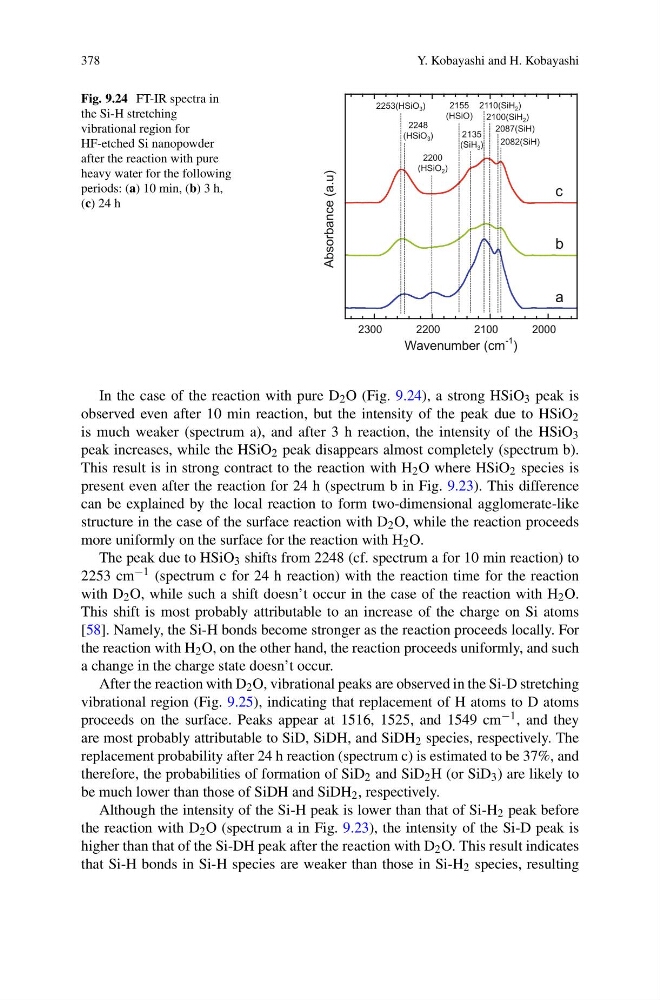
Fig. 9.24 FT-IR spectra in
the Si-H stretching
vibrational region for
HF-etched Si nanopowder
after the reaction with pure
heavy water for the following
periods: (a) 10 min, (b) 3 h,
(c) 24 h
2000
2100
2200
2300
Absorbance (a.u)
Wavenumber (cm
-1 )
a
b
c
2253(HSiO 3 )
2248
(HSiO 3 )
2110(SiH 2 )
2100(SiH 2 )
2087(SiH)
2082(SiH)
2155
(HSiO)
2200
(HSiO 2 )
2135
(SiH 3 )
In the case of the reaction with pure D 2 O (Fig. 9.24), a strong HSiO 3 peak is
observed even after 10 min reaction, but the intensity of the peak due to HSiO 2
is much weaker (spectrum a), and after 3 h reaction, the intensity of the HSiO 3
peak increases, while the HSiO 2 peak disappears almost completely (spectrum b).
This result is in strong contract to the reaction with H 2 O where HSiO 2 species is
present even after the reaction for 24 h (spectrum b in Fig. 9.23). This difference
can be explained by the local reaction to form two-dimensional agglomerate-like
structure in the case of the surface reaction with D 2 O, while the reaction proceeds
more uniformly on the surface for the reaction with H 2 O.
The peak due to HSiO 3 shifts from 2248 (cf. spectrum a for 10 min reaction) to
2253 cm −1 (spectrum c for 24 h reaction) with the reaction time for the reaction
with D 2 O, while such a shift doesn’t occur in the case of the reaction with H 2 O.
This shift is most probably attributable to an increase of the charge on Si atoms
[58]. Namely, the Si-H bonds become stronger as the reaction proceeds locally. For
the reaction with H 2 O, on the other hand, the reaction proceeds uniformly, and such
a change in the charge state doesn’t occur.
After the reaction with D 2 O, vibrational peaks are observed in the Si-D stretching
vibrational region (Fig. 9.25), indicating that replacement of H atoms to D atoms
proceeds on the surface. Peaks appear at 1516, 1525, and 1549 cm −1 , and they
are most probably attributable to SiD, SiDH, and SiDH 2 species, respectively. The
replacement probability after 24 h reaction (spectrum c) is estimated to be 37%, and
therefore, the probabilities of formation of SiD 2 and SiD 2 H (or SiD 3 ) are likely to
be much lower than those of SiDH and SiDH 2 , respectively.
Although the intensity of the Si-H peak is lower than that of Si-H 2 peak before
the reaction with D 2 O (spectrum a in Fig. 9.23), the intensity of the Si-D peak is
higher than that of the Si-DH peak after the reaction with D 2 O. This result indicates
that Si-H bonds in Si-H species are weaker than those in Si-H 2 species, resulting
Y. Kobayashi and H. Kobayashi
Fig. 9.24 FT-IR spectra in
the Si-H stretching
vibrational region for
HF-etched Si nanopowder
after the reaction with pure
heavy water for the following
periods: (a) 10 min, (b) 3 h,
(c) 24 h
2000
2100
2200
2300
Absorbance (a.u)
Wavenumber (cm
-1 )
a
b
c
2253(HSiO 3 )
2248
(HSiO 3 )
2110(SiH 2 )
2100(SiH 2 )
2087(SiH)
2082(SiH)
2155
(HSiO)
2200
(HSiO 2 )
2135
(SiH 3 )
In the case of the reaction with pure D 2 O (Fig. 9.24), a strong HSiO 3 peak is
observed even after 10 min reaction, but the intensity of the peak due to HSiO 2
is much weaker (spectrum a), and after 3 h reaction, the intensity of the HSiO 3
peak increases, while the HSiO 2 peak disappears almost completely (spectrum b).
This result is in strong contract to the reaction with H 2 O where HSiO 2 species is
present even after the reaction for 24 h (spectrum b in Fig. 9.23). This difference
can be explained by the local reaction to form two-dimensional agglomerate-like
structure in the case of the surface reaction with D 2 O, while the reaction proceeds
more uniformly on the surface for the reaction with H 2 O.
The peak due to HSiO 3 shifts from 2248 (cf. spectrum a for 10 min reaction) to
2253 cm −1 (spectrum c for 24 h reaction) with the reaction time for the reaction
with D 2 O, while such a shift doesn’t occur in the case of the reaction with H 2 O.
This shift is most probably attributable to an increase of the charge on Si atoms
[58]. Namely, the Si-H bonds become stronger as the reaction proceeds locally. For
the reaction with H 2 O, on the other hand, the reaction proceeds uniformly, and such
a change in the charge state doesn’t occur.
After the reaction with D 2 O, vibrational peaks are observed in the Si-D stretching
vibrational region (Fig. 9.25), indicating that replacement of H atoms to D atoms
proceeds on the surface. Peaks appear at 1516, 1525, and 1549 cm −1 , and they
are most probably attributable to SiD, SiDH, and SiDH 2 species, respectively. The
replacement probability after 24 h reaction (spectrum c) is estimated to be 37%, and
therefore, the probabilities of formation of SiD 2 and SiD 2 H (or SiD 3 ) are likely to
be much lower than those of SiDH and SiDH 2 , respectively.
Although the intensity of the Si-H peak is lower than that of Si-H 2 peak before
the reaction with D 2 O (spectrum a in Fig. 9.23), the intensity of the Si-D peak is
higher than that of the Si-DH peak after the reaction with D 2 O. This result indicates
that Si-H bonds in Si-H species are weaker than those in Si-H 2 species, resulting